Here’s a quick and timely data science post.
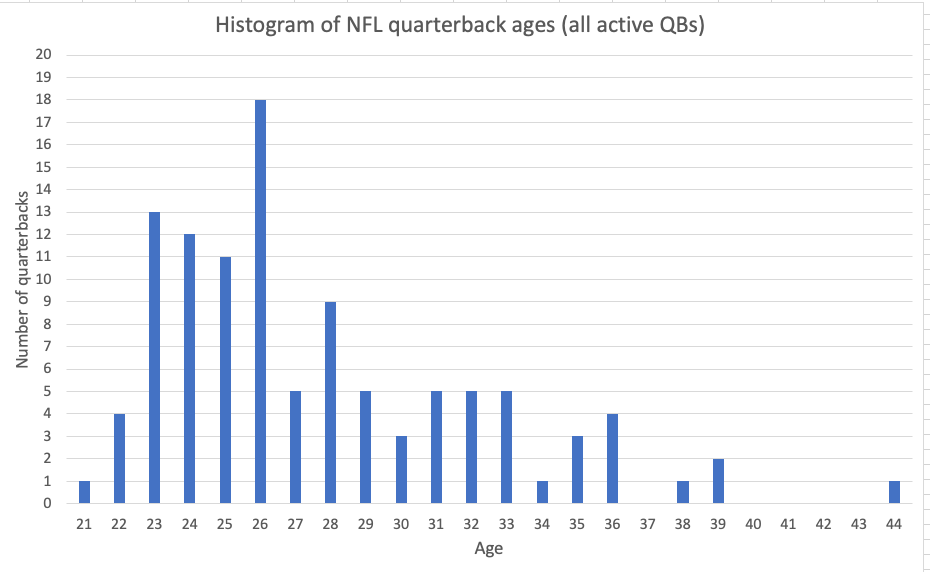
I made a graph (histogram) of the ages of quarterbacks currently playing in the National (American) Football League. The graph is below. Age labels are along the bottom, increasing to the right. Along the left are labels of the number of quarterbacks at each age, increasing going up.
Look at that bar waaaaaaaaaaay oooooooover theeeeeeeeere to the right. Who do you think that is?
Some stats

Number of quarterbacks: 120
Average (mean) age: 27.6 years
Standard deviation (a measure of how spread out the data is): 4.5 years
Conclusion
Love him or hate him, Tom Brady is a freak of nature.
Want to see it for yourself?
Download my Excel spreadsheet!