Daily COVID-19 data update XII

Day twelve of me graphing data, day eighteen of the pandemic (as declared by the World Health Organization), day eighty-nine since the first cases were reported in Wuhan. Worldwide as of 5:30 AM ET this morning, more than 650,000 people have been diagnosed with COVID-19, and more than 30,000 have died. For comparison, that is nearly 10 times the number that died in the 9/11 terrorist attacks.

I am continuing to track the number of cases and deaths in China, the United States, Iran, Italy, Spain, France, Belgium, the United Kingdom, and Australia. As always, the graphs below show cases and deaths per million people in each country.

I have redone the graphs, so they are not directly comparable with the ones I’ve made before, but they show the same countries with the same lines. I also set the horizontal axis (date) to always show the current date on the far right, so that you can tell by just looking at the graph what day it comes from.

Hopefully the graphs are more readable today as well. Click on them to open a larger version in a new tab. Suggestions welcome!

Cases per million people

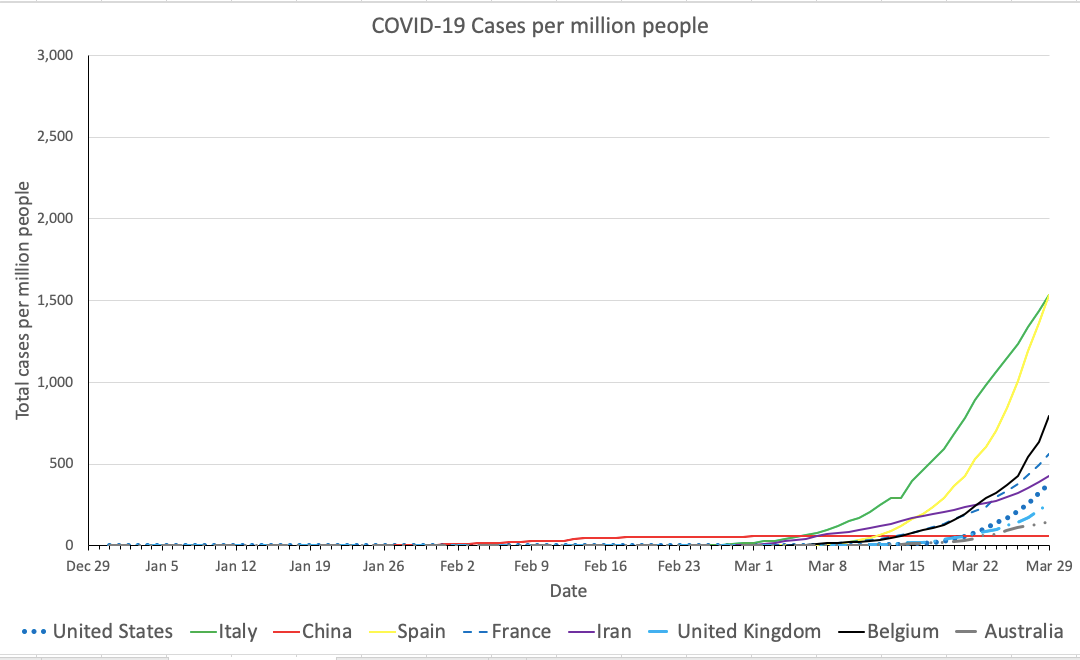
Countries are shown on the same color scale as before, but I have rescaled the graph. The highest case rate in the world is Italy’s at 1,535 per million (80,539 cases in about 60,000,000 Italians).

The vertical axis scale (cases per million people) in my graph now extends to 3,000, so there is now some room for the graph to grow into. But since the doubling time of cases is about 3 days, this room is likely to only last about 3 days, and then I’ll have to rescale again.
That’s what doubling time means – in three days, as many people will have caught COVID-19 as have ever caught it since it began at the seafood market in Wuhan.

Looking at patterns in individual countries, the number of reported cases in Spain continues to grow at a frightening rate. The cases per million people in Spain has not quite passed the cases per million in Italy (which was my prediction yesterday), but it’s damn close, and Spain will certainly take over the top spot tomorrow. The rate seems to have slowed down in Australia, but the same caveats apply.

It looks like the rate has started to increase again in Iran, but that could be due to better testing and reporting, and it could be random chance. Let’s keep a close eye in Iran over the next few days.

Deaths per million people

Sigh, I rescaled the graph yet again, and I hope the new rescaling will last three days before I have to do it yet again (remember, three day doubling time, and it might be even faster). The death rate is now 166 per million in Italy and 121 per million in Spain.
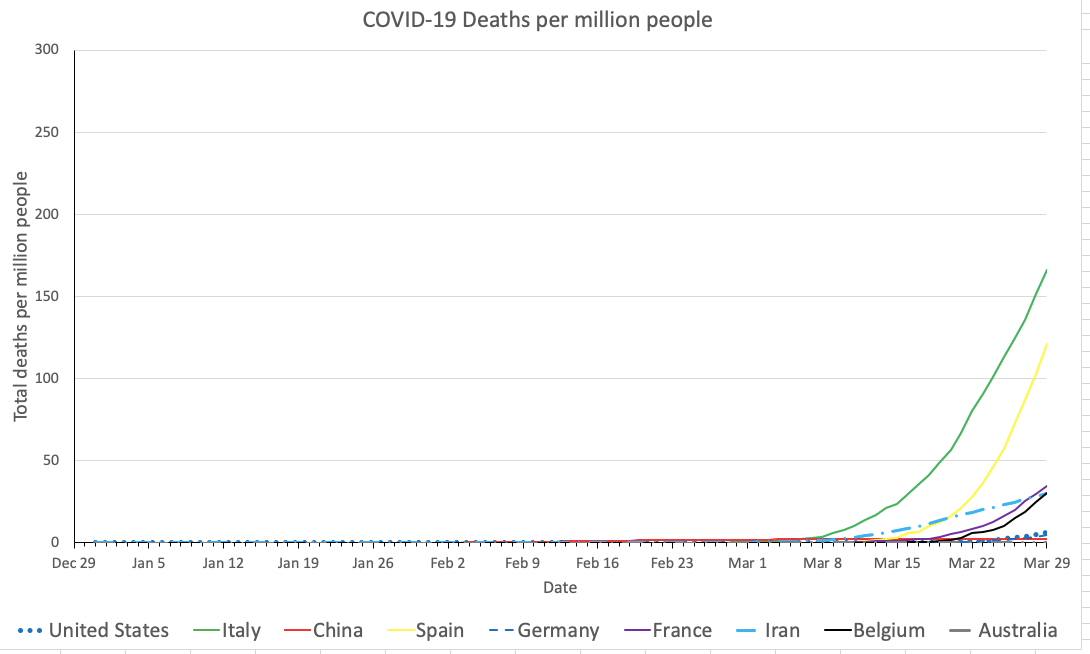
Per capita death rate has some lag behind per capita case rate – the time it takes patients to get sick and die.

My goal in doing this it to help you realize that you can make these kinds of graphs yourself. Links that will help you do that are in the postscript.

I’ll leave you with a question:

What important graph have I not yet shown you?

I’ll answer this, and show you the graph, later today.

Postscript: Data Resources

You can find the data from the European Centers for Disease Control’s Coronavirus Source Data site (download the CSV file from the “Full dataset” link).

I have revised my Excel template make the graphs above, plus the secret one I’m working on. It should also be easier to add new data each day, although it still takes several manual steps. Here is the new template.

Update tomorrow, and every day until this pandemic is over.

Daily COVID-19 data update XI

Day eleven of me graphing data, day seveteen of the pandemic (as declared by the World Health Organization), day eighty-eight since the first cases were reported in Wuhan. Worldwide as of 4 AM ET this morning, nearly 600,000 people have been diagnosed with COVID-19, and more than 27,000 have died.

I am continuing to track the number of cases and deaths in China, the United States, Iran, Italy, Spain, France, Belgium, the United Kingdom, and Australia. As always, the graphs below show cases and deaths per million people in each country.

Cases per million people

The number of reported cases in Spain continues to grow at a frightening rate. By the time you read this, Spain’s per capita disease rate will almost certainly have passed Italy’s.

Spain’s curve is about a week later than Italy’s, so their per million deaths will almost certainly pass Italy’s as well. The growth of cases in the United States is beginning to to enter the scary part of the curve. Meanwhile in Australia…

…cases might have flattened out, but we won’t know for sure for a few days.

Deaths per million people

Sigh, I rescaled the graph yet again, the total death rate in Italy is now 152 deaths per million Italians (the green line in the graph below). The death rate is Spain is increasing quickly.

You can find the data from the European Centers for Disease Control’s Coronavirus Source Data site (download the CSV file from the “Full dataset” lin), and you are welcome to use my Microsoft Excel template. I’m working on some new graphs for future updates, you should too!

Update tomorrow, and every day until this pandemic is over.

Daily COVID-19 data update X

Day ten of me graphing data, day sixteen of the pandemic (as declared by the World Health Organization), day eighty-seven since the first cases were reported in Wuhan. Pause for a moment and think about how fast this thing has spread – as of today, more than 500,000 cases have been reported worldwide.

Cases per million people

Today the United States has passed China to become the country with the largest number of total reported cases (85,991 for the U.S. vs. 82,079 for China and 80,539 for Italy). That’s 261 cases per one million Americans, as shown in the per capita graph below – four times the case rate of China, but still one-fifth of the rate in Italy.

The rate at which new cases are being diagnosed continues to slow slightly in Italy, continues to increase at a frightening clip in Spain and Belgium, and sits somewhere in the middle in the U.S.

Some of the growth, particularly in the U.S., is likely due to more widespread testing rather than people being newly infected. That’s only mildly good news, though, because until testing rates get much higher, there are still lots of people transmitting COVID-19 who don’t know they are transmitting COVID-19.

Deaths per million people

Sigh, I rescaled the graph again, the total death rate in Italy is now 136 deaths per million Italians (the green line in the graph below).

Deaths per million people have also increased sharply in France (blue dashed line) and Belgium (solid black line).

You can find the data from the European Centers for Disease Control’s Coronavirus Source Data site (download the CSV file from the “Full dataset” lin), and you are welcome to use my Microsoft Excel template. I’m working on some new graphs for future updates, you should too!

The good news is that I had some company for today’s graphing – my cat Simon colonized my lap and refused to leave until I finished writing this post. Here’s the adorable selfie:

Update tomorrow, and every day until this pandemic is over – on both the data and the cat.

Daily COVID-19 data update IX

Day nine. Once again presenting the graphs of COVID-19 cases and deaths per million people for various countries that have been discussed in the “news” in the last few weeks. Remember that these are per-capita graphs, which make the data easier to interpret in some ways and harder in some other ways.

In yesterday’s charts, it appeared that the rate of new case reports had begun to slow down in Italy and the United States. How does the chart look today, March 26th, 2020?

Cases per million people

Italy, yes, it looks like the case rate is slowing down. United States, not so much.

Here are the number of new cases reported each of the last five days in each country. Obviously it’s hard to find a trend after 5 days, so I wouldn’t put too much stock in either column – but the stories for Italy and the USA look like different stories.

DateItalyUSA
2020-03-226,5577,123
2020-03-235,5608,459
2020-03-244,78911,236
2020-03-255,2498,789
2020-03-265,21013,963
Newly-reported cases the last five days in Italy and the United States

Regardless, it’s far too early to think about relaxing social distancing measures in either place. We’ll keep an eye on these numbers over the coming weeks.

Deaths per million people

Sadly, it’s time for another rescale, as the total number of deaths in Italy goes above 7,500 in a country of 60 million, for 125 total deaths per million people. Spain is not far behind with 73 deaths per million people.

You can find the data from the European Centers for Disease Control’s Coronavirus Source Data site (download the CSV file from the “Full dataset” lin), and you are welcome to use my Microsoft Excel template. I’m working on some new graphs for future updates, you should too!

Update tomorrow, and every day until this pandemic is over.

Daily COVID-19 data update VIII

Day eight. Once again presenting the graphs of COVID-19 cases and deaths per million people for various countries that have been discussed in the “news” in the last few weeks. Remember that these are per-capita graphs, which make the data easier to interpret in some ways and harder in some other ways.

Some good news and some bad news in today’s charts. First, the charts:

Cases per million people

Deaths per million people

The bad news comes from the Deaths per million people graph. Italy is now literally off the chart. For the past few days, I have been plotting the vertical axis (deaths per million people) between 0 and 75, but the cumulative death rate from COVID-19 in Italy today has hit 113 per million (6,820 deaths so far in a country of 60 million people). I reset the scale to run from 0 to 120 cumulative deaths per million people. I fear I will likely have to reset the scale a few more times before the dying levels off.

The maybe good news might come from the graph of cases per million people. It looks like the slope of the line for Italy is starting to turn over. While the total number of cases in Italy is still increasing because new cases are still being reported, fewer new cases are being reported today than a few days ago. Some experts (which I am not) have interpreted this as showing that social distancing measures in Italy have begun to work. We’ll see if this trend continues.

As always, I’d love to hear your thoughts. You can find the data from the European Centers for Disease Control’s Coronavirus Source Data site (download the CSV file from the “Full dataset” lin), and you are welcome to use my Microsoft Excel template. Some of you have sent me graphs and ideas (hi David! hi Aimee! Hi Ed!), and I’ll respond to you once I’m more caught up on my Actual Job.

Update tomorrow, and every day until this f@cking terrible pandemic is over.