Guest Post! One of the joys of being alive is having smart, curious friends to talk with – or to write guest posts for your blog. I’d love to see more of these, especially from friends with perspectives and opinions different from my own – email me your ideas!
Aaron talks about an important question in today’s age of COVID-19: are people actually following the CDC’s advice to avoid large holiday gatherings?
Because I’m a nerd who works in data for a living, I wanted to see what evidence we have for people staying home this Thanksgiving.
In a widely reported prediction, AAA forecasted a 50% drop in air travel but only a 10% drop in overall travel. But, of course, we have to remember it’s the AMERICAN AUTOMOBILE Association that is saying that AMERICANS are robustly driving AUTOMOBILES this holiday. They don’t cite the source for their forecast, other than to say it was based on mid-October “models.” Even if those unexplained “models” are reliable, they still don’t include the impact of the last six weeks of the fall COVID-19 surge – or the whole prediction could be just a bunch of marketers throwing darts at a board.
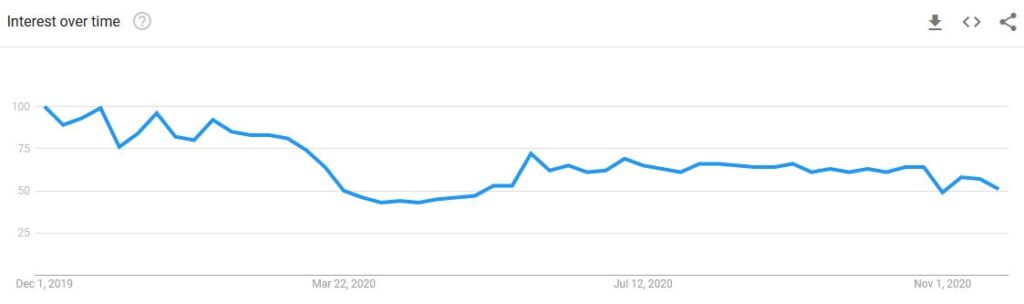
Anyway, I looked at Google Trends for the word “traffic†a few days before the 2019 Thanksgiving vs. the last few days. Days on which more people search for the word “traffic” presumably are days on which more people are driving their cars. I graphed the results on the same relative y-axis scale, to place them on the same zeropoint – the vertical axis goes from zero percent (the number of Google searches for “traffic” on the day in which the fewest people searched for “traffic”) to 100 percent (the number the day the most people searched for “traffic.”). The graph is below.
Google searches for the word “traffic,” relative to the number of searches on December 1, 2019
The graph does indeed show an almost 50% drop year-over-year.
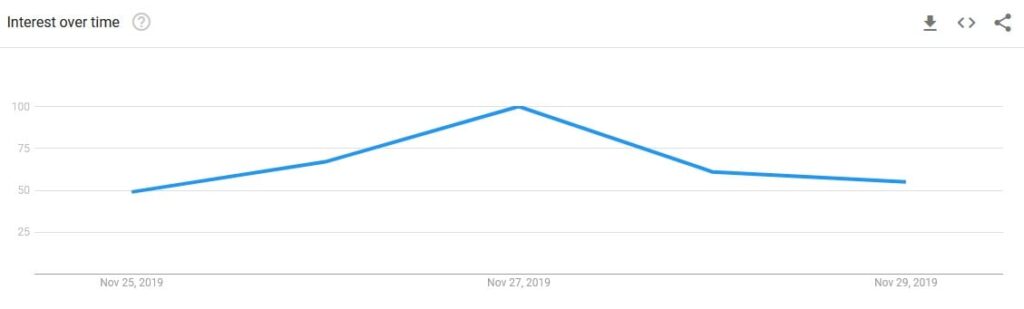
In the same article, AAA predicts the peak travel time to be the afternoon of the day before Thanksgiving. This is supported by last year’s Google Trends search data, which shows that searches for the word “traffic” did indeed peak on the day before Thanksgiving, which in 2019 came on Wednesday, November 27th.
Relative searches for the word “traffic” in the days before Thanksgiving 2019
Indeed, looking at the traffic over the days leading up to Thanksgiving 2019 does indeed show a jump of about 50% from Tuesday to Wednesday. We could look at the same trends in 2020 – except that at the moment, Google’s data only goes to up to 1 AM ET on Wednesday November 25th. So we’ll have to wait until at least tonight to see how many people searched for “traffic” yesterday (Wednesday). I’ll post an update here later for those of you on the edge of your seats.
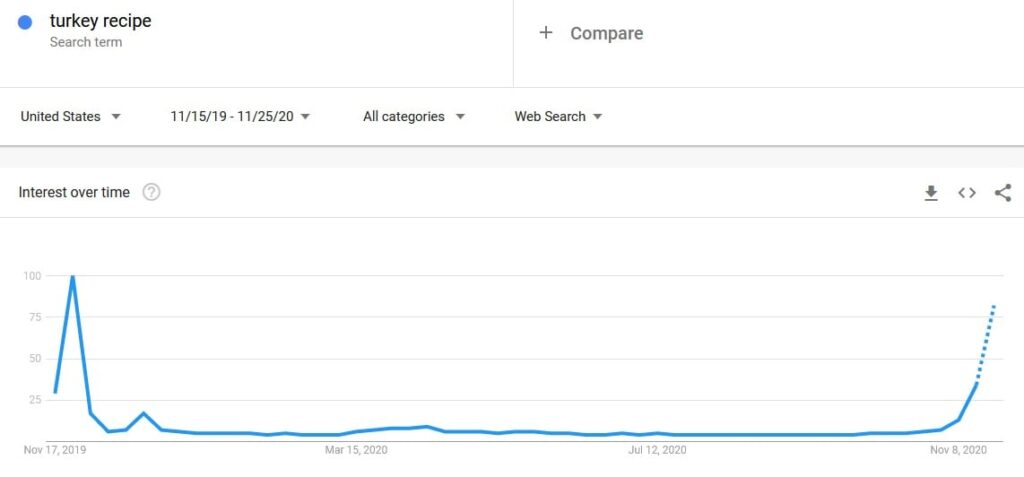
I also checked Google Trends for recent searches for “turkey recipe,” with the assumption that in 2020, fewer large group gatherings will mean less turkey being cooked, because people don’t want to cook a turkey for a smaller group – although this could be debated, since four families staying home instead of going to grandma’s could mean four dead turkeys instead of one). The graph below shows the number of Google searches within the U.S. for “turkey recipe” from just before Thanksgiving 2019 to just before Thanksgiving 2020.
Google searches for “turkey recipe” by day, using a relative scale from zero to 100
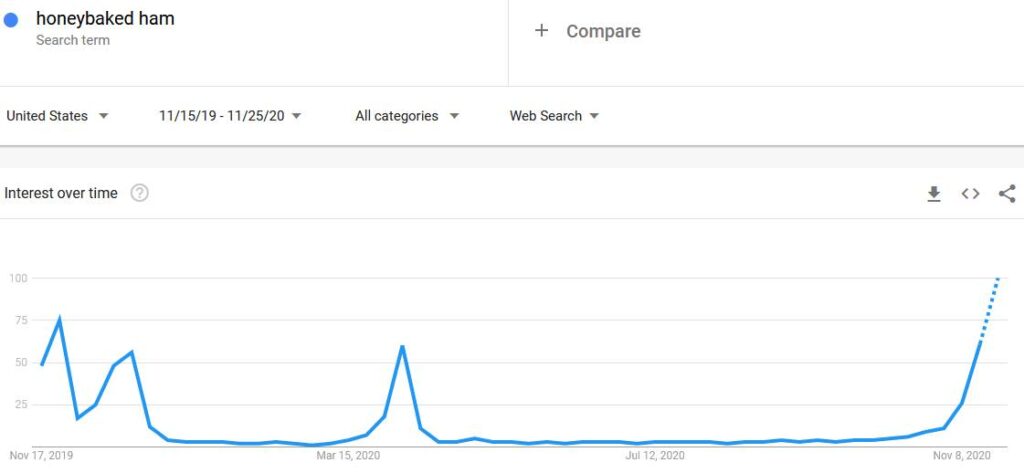
Indeed, Google Trends shows that turkey recipe searches are down 25% over this time last year. Interestingly, the graph below shows U.S.-based Google searches for “honeybaked ham,” again between just before Thanksgiving 2019 and just before Thanksgiving 2020, again on a relative scale.
Searches for “honeybaked ham” from Thanksgiving 2019 to Thanksgiving 2020 on a relative scale
Searches for “honeybaked ham†are up almost exactly 25% over last year! Does this mean people prefer ham with smaller gatherings? Or that, when no one is looking, we all actually prefer ham over turkey? Count me in that group.
I also looked at searches for “flight status,†and those searches are down about 75% over this time last year.
My prediction
How will these trends hold up over the next few days? And – more importantly – what impact will this week end up having on COVID-19 cases in the U.S. over the coming weeks?
My prediction: overall, automobile travel will be down about 25% over last year and flights down about 50-75% over last year. So, about a third of our country is planning to do less for Thanksgiving than they would typically do. Which would make sense given our political makeup. About 1/3 are very liberal and take COVID-19 super seriously. About 1/3 are very conservative and believe it’s all fake. And 1/3 believe it is real and are concerned enough to make small to medium changes in lifestyle, but not enough to make major changes in lifestyle such as skipping a traditional Thanksgiving gathering.
Thus, we should see a surge in cases starting around December 6th. If I’m right, it may start out at about a 30% jump over this week’s pre-Thanksgiving rates… before the increase goes exponential.
I closed Monday’s review of my House predictions with an observation that I amazingly haven’t seen anyone else make: the Republicans actually came very close to capturing control of the House of Representatives. How close?
The current seat count in the U.S. House of Representatives is Democratic 220, Republican 202 – likely to go up to Republican 205 once the final three seats are decided. That means that if eight elections had gone Republican instead, the count would be Republican 213 Democratic 212.
The table below shows the eight closest races in which the Democratic candidate won. Adding up all the margins gives the minimum number of extra Republican votes that would have been required to give control of the House to the Republicans – provided of course all the votes had come in exactly the right places.
District
Democratic
D votes
Republican
R votes
Margin
Pct margin
IL-14
Underwood
203,195
Oberweis
197,818
5,377
1.3%
IA-3
Axne
219,205
Young
212,997
6,208
1.4%
VA-7
Spanberger
230,893
Freitas
222,623
8,270
1.8%
PA-17
Lamb
221,547
Parnell
211,951
9,596
2.2%
WI-3
Kind
199,870
Van Orden
189,524
10,346
2.7%
MN-2
Craig
204,031
Kistner
194,466
9,565
2.4%
MI-11
Stevens
226,128
Esshaki
215,405
10,723
2.4%
TX-15
V. Gonzalez
115,594
De La Cruz-Hernandez
109,005
6,589
2.9%
The eight closest races with a Democratic winner
The final count: 66,674. That’s not very many voters.
As happens every even-numbered year, all 435 seats in the House of Representatives were up for a vote. I predicted the outcomes of them all on a map, and discussed detailed predictions in part 2 and part 3). How did I do in predicting the results of those elections?
What We Still Don’t Know
The answer is, “we don’t know for sure yet,” because there are four results still unknown.
The weird one
Louisiana-5: As with the two Senate Elections in Georgia, we don’t know the winner in Louisiana’s 5th congressional district, which covers the whole northeastern quarter of the state and includes Monroe and Alexandria. Like Georgia, Louisiana uses a “jungle primary” system where all candidates appear on the ballot regardless of party. If one candidate gets 50 percent of the vote, they win the election; if not, the top two candidates face off in a runoff. The top two finishers were Republicans Luke Letlow (33.1% election day vote share) and Lance Harris (16.6%), leaving us in the weird position of knowing that a Republican will represent LA-5, but we still don’t know which one.
The exciting ones
And there are also three house races where both winner is still unknown, and might be from either major party:
California-21 (the southern third of the Central Valley and the east side of Bakersfield): with 95 percent of ballots counted, Republican former representative David Valadao (83,564 votes; 50.5%) leads Democratic incumbent T.J. Cox (81,946; 49.5%). CURRENT RESULTS
California-25 (rural-ish Los Angeles and Ventura Counties, including Palmdale, Santa Clarita, and the San Fernando Valley): with 87 percent of ballots counted, Republican incumbent Mike Garcia (169,060 votes; 50.1%) leads his former special election Democratic opponent Christy Smith (168,660; 49.9%). That’s a difference of just 400 votes, smaller than my high school graduating class. CURRENT RESULTS
Iowa-2 (the southeastern quarter of Iowa, including Davenport and Iowa City): the most mind-blowing one of all… with all votes counted and currently being recounted by hand, Republican Marianette Miller-Meeks (196,862 votes; 50.006%) leads Democratic candidate Rita Hart (196,815; 49.994%) BY JUST 47 VOTES. That’s literally less people than would fit on a single bus! CURRENT RESULTS
Iowa’s second district race is headed to a recount, but recounts almost never change election results, so the most likely outcome is a ridiculously narrow win by Miller-Meeks. What is especially remarkable about this race is that neither I nor anyone else had this on our radar as a close race; Hart was expected to win easily. But so it always goes on election night – there is always at least one race that defies expectations. That’s the nature of trying to predict 435 different things; enough opportunities for outcomes to occur virtually guarantees that there will be a rare outcome somewhere, somehow.
So there are those four uncertainties, but that still leaves 431 certainties. How did I do in my predictions?
Hits and Misses
My top line result for the House of Representatives was that the party count would be a good result for the Democratic Party: 237 seats going Democratic and 198 Republican, for a net swing of five seats Democratic.
In reality, the Democratic majority remains, but the House elections feel very much like a win for the Republicans. Not including the three seats yet to be decided, the count is 230 Democratic, 202 Republican. Republicans have a narrow lead in all three undecided races, meaning the result most likely result is a swing of seven seats in favor of the Republicans.
I have some ideas about why the 2020 House and Senate elections were so good to the Republicans, but that’s a topic for a different post. What matters here is: how right or wrong were my predictions? And for evaluating my predictions, the important question is not the swing, but rather the individual election results.
Here is my the map of the outcome of my predictions. Colors indicate the party of the winning candidate, using the traditional yet arbitrary red for Republican and blue for Democratic. Districts whose calls I missed are shown with their winner’s name in BIG BOLD ALL-CAPS.
Checking my predictions for the 2020 U.S. House of Representatives elections. Click for a larger version.
The map shows that my predictions were correct for 417 of the 432 decided House seats. That’s a 96.5 percent success rate, although it’s less impressive than it sounds when you realize how gerrymandering has made most House elections completely uncompetitive. It’s also less impressive when you realize the systematic offset: I mistakenly predicted one Republican win in a seat that went Democratic, and FOURTEEN Democratic wins in seats that went Republican. If Garcia holds on in California-25 and Miller-Meeks in Iowa-2, the latter number goes up to SIXTEEN.
Here are the districts where I got it wrong. Click the district names to see the district’s Wikipedia page, which includes a map; click on RESULTS see the results from the most official source I could find (and many thanks to the websites of the Secretaries of State of California and Utah for making their official state counts so easy to find and link to):
California-39 (eastern suburbs of LA, including Fullerton and Yorba Linda): Republican state assembly woman Young Kim (173,312 votes; 50.6 percent vote share) defeated Democratic incumbent Gil Cisneros (169,089; 49.4 percent). RESULTS
California-48 (coastal Orange County, including Huntington Beach and Laguna Beach): Republican county councilwoman Michelle Steel (201,660 votes; 51.1 percent vote share) defeated Democratic incumbent Harley Rouda (193,305; 48.9 percent). RESULTS
Colorado-3 (the western half of Colorado, including Aspen, Grand Junction, and Pueblo): Republican bar owner and gun rights acitvist Lauren Boebert (220,502 votes; 51.4 percent vote share) defeated Democratic state representative Diane Mitsch Bush (193,980; 45.2 percent). RESULTS
Florida-26 (southern Miami-Dade County and the Florida Keys, including Homestead and Key West): Carlos Gimenez, the Republican county commissioner of Miami-Dade County (177,223 votes; 51.7 percent vote share) defeated Democratic incumbent Debbie Murcasel-Powell (165,407; 48.3 percent). RESULTS
Florida–27 (cities of Miami, Miami Beach, and Coral Gables): in another race that was absolutely not at all on anyone’s radar, Spanish-language TV news host Maria Elvira Salazar (176,141 votes; 51.4 percent vote share) shocked long-revered Democratic incumbent Donna Shalala (166,758 votes; 48.6 percent). The unexpected result, like Trump’s unexpected advantage in Miami-Dade County, is further evidence that that Trump’s messaging resonated in Miami. RESULTS
Georgia-7 (northeastern suburbs of Atlanta, including Duluth, Norcross, and Suwanee): The Democratic 2018 candidate, Professor Carolyn Bourdeaux (190,900 votes; 51.4 percent vote share) defeated emergency room doctor and Marine Corps veteran Rich McCormick (180,564; 48.6 percent). I predicted this race would be within-one-percent close, but I picked the wrong winner. It was the only race where I pick d a Republican and the seat went Democratic. RESULTS
Indiana-5 (city of Indianapolis and its northern suburbs, including Carmel and Marion): In another election I predicted would be within-one-percent close – but was not – Republican state senator Victoria Spartz (208,212 votes; 50.0 percent vote share) defeated Democratic former state representative Chrstina Hale (191,226; 45.9 percent). RESULTS
Iowa-1 (northeastern quarter of Iowa, including Cedar Rapids and Dubuque): in another race that I thought would not be at all competitive, I was blindsided by a loss for the Democratic incumbent. Republican former Cedar Rapids TV news anchor Ashley Hinson (212,088 votes; 51.3 percent vote share) defeated Abby Finkenauer (201,347; 48.7 percent). RESULTS
New Mexico-2 (the southern part of the state, including the southern part of Albuquerque, Las Cruces, and Roswell): a rematch of the 2018 election goes the other way, as Republican state representative Yvette Herrell (142,169 votes; 53.8 percent vote share) defeated Democratic incumbent Xochtil Torres Small (122,314; 46.3 percent) by a surprisingly large margin. RESULTS
New York-2 (the South Shore of Long Island, including Islip, Massapequa, and Ronkonkoma): New York state assemblyman Andrew Garbarino (164,272 votes; 56.4 percent vote share) won the election to replace the retiring senior Republican Peter King, by defeating Democratic challenger Jackie Gordon (124,071 votes; 42.6 percent). RESULTS
New York-11 (Staten Island and far southwestern Brooklyn): State assemblywoman Nicole Malliotakis (136,382 votes; 56.4 percent vote share) returned New York City’s most conservative district to Republican control, defeating one-term Democratic incumbent Max Rose (99,224 votes; 41.1 percent vote share). RESULTS
New York-22 (the bridge of the nose, including Binghamton and Utica): in a rematch of 2018 with a different result, Republican attorney and publisher Clauida Tenney (149,769 votes; 50.5 percent vote share) unseated Democratic incumbent Anthony Brindisi (140,644; 47.4 percent). RESULTS
Utah-4 (rural central Utah plus the southern edge of Salt Lake City because gerrymandering): As part of 2018’s “blue wave,” Ben McAdams made this the most Republican-leaning district with a Democratic representative – but like the Alabama Senate, it was always going to be tough to hold the seat. Republican candidate and former Jets and Raiders American football safety Burgess Owens (179,688 votes; 47.7 percent vote share) defeated McAdams (175,923; 46.7 percent). Someday I will look up former American football players in Congress and decide an all-star team, but this post is already long and is about to get longer. RESULTS
Margins of victory
District
Margin
NJ-7
1.2%
TX-24
1.3%
UT-4
-1.0%
CA-39
-1.2%
CA-48
-1.2%
MN-1
3.0%
TX-7
3.3%
NE-2
4.3%
AZ-6
4.4%
MI-3
6.0%
MO-2
6.4%
TX-21
6.5%
NC-8
6.6%
FL-26
-3.4%
TX-22
6.9%
OH-1
7.2%
NY-22
-3.8%
TX-23
-4.0%
IL-13
8.8%
AK
9.0%
GA-6
9.2%
AR-2
10.8%
MT
12.8%
MN-7
13.5%
MI-6
15.7%
NY-11
-15.8%
Elections I predicted would be close, and their actual margins
As I had discussed when I evaluated my Senate picks on Saturday, I predicted not only the winner of each contest, but also which would be close (within 5% vote share) and very close (within 1% vote share). How did I do?
I predicted that 26 races would be close – decided by a vote share of more than 1 percent but less than 5 percent. I looked up the actual vote share margin of those 26 races, defined as the percent vote share for the winning candidate minus that for the losing candidate. The table to the left (or above if you’re on a small screen) shows the results of those 26 races.
Because of votes for third-party candidates, the vote shares do not always add up to 100 percent; but that doesn’t matter because I only considered the difference. For a few of the close races I predicted, I missed not only the margin but also the winner. Those races are described in more detail in the Hits and Misses section above, and I somewhat arbitrarily decided to double the penalty for missing the margin. Of my 26 predicted close races…
NINE were actually close, decided by between 1 and 5 percent once I applied the double-penalty for picking the wrong winner. The one that I missed most hilariously was New York-11, described above, where I predicted a close win for Max Rose but Nicole Mallonakis won by a shocking 15.8 percent.
What about the races that I predicted would be very close, within one percent vote share or less? The table to the left (or below if you’re on a small screen) show the results.
District
Margin
CA-25
-0.2
CA-21
1
OK-5
4.2
VA-5
5.2
GA-7
-2.8
NJ-2
5.7
PA-10
6.6
IN-5
-4.1
CO-3
-6.2
NY-24
14.1
NY-2
-13.8
Elections I predited would be very close, and their actual margins
Of the 11 races that I predicted would be very close, two actually were very close – the two in California that are so close we don’t yet know who won. One more (OK-5) was within 5 percent. The other eight were decided by even more than 5 percent. Most hilariously wrong were the elections in NY-2 and NY-24, where I picked the wrong candidate, and the other candidate won by 13.8 percentage points.
Correctly calling of 26 close and 2 of 11 very close races is not great, but even that doesn’t tell the full story, because there were races that I did not expect to be close that turned out to be close. The most obvious example of a miss to that side was Iowa-1, where I picked incumbent Abby Finkenauer to win easily, but actually she lost by 3.6 percentage points. In addition to her and Donna Shalala in Florida-27 (who lost by 2.8 percentage points), there were an additional 17 where my predicted candidate won, but by less than 5 percentage points. Those unexpectedly close races are shown in the table below.
What do all 19 of these districts have in common? They were all occupied by Democratic representatives. Two of them have changed parties and are now represented by Republicans. The other 17, like the House as a whole, remain Democratic, but by a much smaller margin than expected.
District
Margin
IA-2
-0.0
IL-14
1.4
IA-3
1.4
VA-7
1.8
PA-17
2.0
WI-3
2.0
MN-2
2.2
MI-11
2.4
TX-15
2.9
NV-3
3.0
AZ-1
3.2
MI-8
3.6
PA-8
3.6
WA-8
3.6
PA-7
3.8
IL-17
4.0
NV-4
4.9
FL-27
-2.8
IA-1
-3.6
Races that were unexpectedly close, with their actual margins
That was supposed to be the end of this post – an evaluation of how I did in predicting the 2020 House elections. Not great, but not bad for a first attempt. I’ll take it.
But this is not the end of this post, because in fact, doing this comparison has made me realize something that I hadn’t realized before, and I haven’t heard anyone else observe either: the Republicans came very close to winning the House. Once all the seats are decided, it looks like the balance of power will be Democratic 220, Republican 205. If eight elections had gone the other way, the balance would be Republican 213, Democratic 212.
How many additional Republican votes would it have required to swing the eight closest elections in their favor? Those are the districts in the second through ninth row of the table to. the right (or above if you’re on a small screen), from Illinois-14 to Texas-15. I’m calculating that number now, and I’ll let you know on Wednesday.
And if there is one ironclad rule in American elections, it’s that the President’s party suffers significant losses in Congress in the first midterm election. Which means that there is a good chance that the Republicans will control both houses of Congress in 2022. What impact would that have on our system?
Hang on folks, because I think I found a game-breaking glitch in democracy.
On Wednesday, I took a look at back at my predictions for the 2020 U.S. Presidential election to see how I did. I successfully predicted every electoral vote except for the 29 in Florida and one in Nebraska’s second congressional district. But as important as this year’s Presidential election was – after all, everyone said it was The Most Important Election Of Our Lifetimes(TM) – it was not the only election this month, nor was it the only election I predicted.
I also made predictions for the 35 open seats in the 2020 U.S. Senate elections, and the 435 open seats in the 2020 U.S. House elections (including more detailed predictions in part 2 and part 3). Today, I’ll evaluate my predictions for the Senate. Up next, the House.
How did I do in predicting the results of those elections?
What We Still Don’t Know
The answer is, “we don’t know for sure yet,” because there are a few elections whose results are not yet known. Both of Georgia’s senate elections finished with no candidate claiming more than 50 percent of the votes, meaning they are headed to a runoff on Tuesday, January 5th, 2021. One runoff election will match Republican David Perdue (49.7% election day vote share) and Democratic candidate Jon Ossoff (47.9%); the other will match the Democratic winner Raphael Warnock (32.9% election day vote share) against the higher vote-getter of the two major Republicans, Kelly Loffler (25.9%). Republicans will be favored to win both elections.
So there are those two uncertainties, but that still leaves 33 certainties. How did I do in my predictions?
Hits and Misses
My top line result was that the Senate would be split evenly, 50 seats to 50, and that the Democratic Party would win tiebreakers thanks to Vice President Kamala Harris. That prediction could still come true, if both runoff elections in Georgia go Democratic. That is definitely possible, and as a Democratic not-in-Georgia Party Member I will do what I can to make it happen, but it’s unlikely. I think it’s more likely that the final Senator count will be Republican 52, Democratic 48.
The map below compares my predicted Senate results to the actual results as we know them now. Each hexagon represents a senator. Their colors show the party affiliation of the election winner; red is republican and blue is democratic. The pink, cyan, and lavender hexagons are incumbents (Republican, Democratic, and Independent respectively) who were not up for re-election this year. The as-yet-undecided races in Georgia are dark purple. Races that I mis-predicted are shown in BOLD ALL-CAPS.
Checking my predictions for the 2020 U.S. Senate elections. Click for a larger version.
Not counting my as-yet-unconfirmed Georgia predictions, I missed on two, both Republican incumbents. In North Carolina, Thom Tillis (R-NC) beat lawyer Cal Cunningham; in Maine, Susan Collins (R-ME) beat state house speaker Sara Gideon.
Margins of Victory
What about my predictions for which races would be close? Not including Georgia, I predicted that eight races would be decided by five percent vote share or less, and that two would be decided by one percent or less. In reality, none of the elections were that close: none were decided by one percent or less, and only three were decided by five percent or less. Although was wrong about Tillis’s win in North Carolina, I did predict the election would be within five percent (the final margin was 1.8 percent). I was also right about Mark Kelly in Arizona (2.4 percent) and Gary Peters in Michigan (1.7 percent).
But I missed badly on some other predictions of close elections. I had predicted a less than 1 percent margins for Gideon in Maine; in reality, Collins won by 8.9 percent. I predicted a Joni Ernst win in Iowa by less than 1 percent; the actual margin was 7.9 percent. And I missed on five of the five-percent races as well: John Hickenlooper won by 9.3 percent in Colorado, Steve Daines by 10 percent in Montana, Lindsey Graham by 10.3 in South Carolina, Roger Marshall by 11.9 in Kansas, and Tommy Tuberville by 20.4 in Alabama.
The lesson here? Predicting a close election is good for pageviews, but they can’t all be close.
The bigger lesson? Revisiting predictions to see what has come true and what has not is a powerful way of learning how to do better and better. It’s so easy, I wish more people were willing to do it.
Coming up next: my predictions for the House of Representatives.
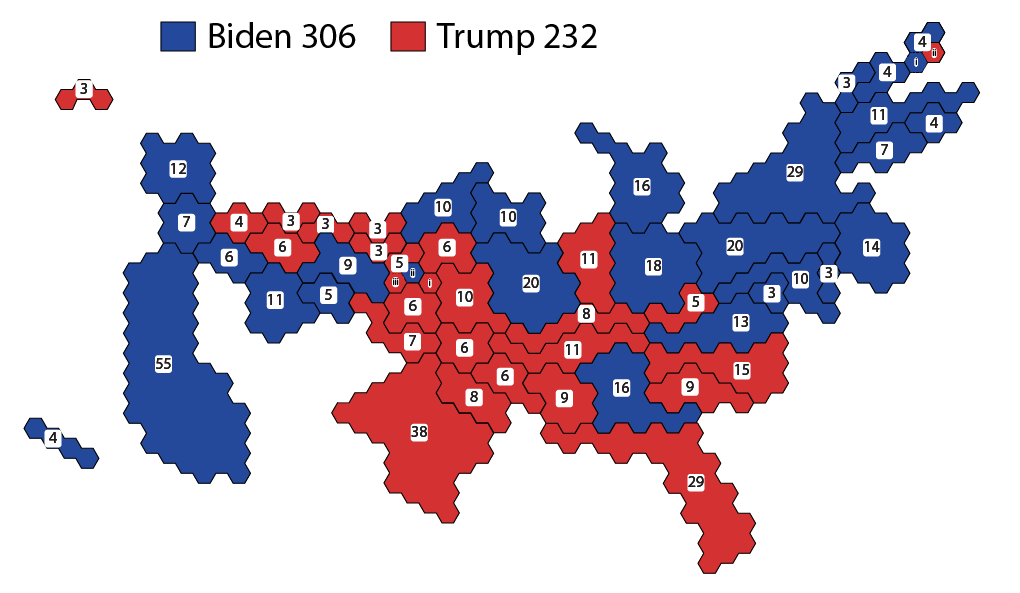
Two weeks and a day after the 2020 Presidential election, we finally know the results of each state. The last to be called was Georgia, and thus the final electoral map looks like this:
The final electoral map for the 2020 Presidential election: Biden 306 Trump 232
So now that we know the final results, how did my prediction go?
Permit me a humblebrag, except maybe without the humble part, because I got
48.8 out of 50 states right!
Awwwwwwwww yeah.
Joel Zimba, probably
I missed on only Florida (29 electoral votes) and Nebraska’s second electoral district (1 electoral vote). I finished tied with Nate Silver, who also missed only Florida and Maine’s second congressional district going to Trump. My electoral vote total was farther off because of Florida’s 29, so the winner of the predict-off is… Joel Zimba! Congratulations Joel!
What my map proves, and Joel’s, and Nate Silver’s, is that once all the votes were counted, the polls were pretty much right on, with one major exception. Polling strongly underestimated Trump’s performance in Miami-Dade County, Florida, where Trump’s messaging was far more successful with Cuban-Americans than anticipated.
The probability of successfully predicting different numbers out of 50 states at 89% probability for each
But remember that because of the electoral college, it’s not one election, it’s 50 separate elections. When you predict 50 different states with Nate Silver’s expected 89 percent probability (and yes, I know it wasn’t the same for every state, this is just a guesstimate), the probability of getting at least one state wrong is more than 99 percent.
The point of this is not to excuse the states that I missed – because seriously folks, I missed very little – but to remind us all that predicting future events is hard. All we can do is the best we can with the information that we have at the time.