Thanksgiving is my favorite holiday.
It gives us all a chance to reflect on what we are thankful for. I have so many things to be grateful for, including this blog, and you the reader. And I’m grateful for the skills I have developed in data science.
I love the idea that there is truth hidden in plain sight, if only we have the patience to look for it.
And now we have two fun data science problems to work on. First, we are near the end of the vote counting for the 118th U.S. House of Representatives. Just three seats remain! Republicans now hold a 220-212 edge – enough for majority control, but far short of their expectations.
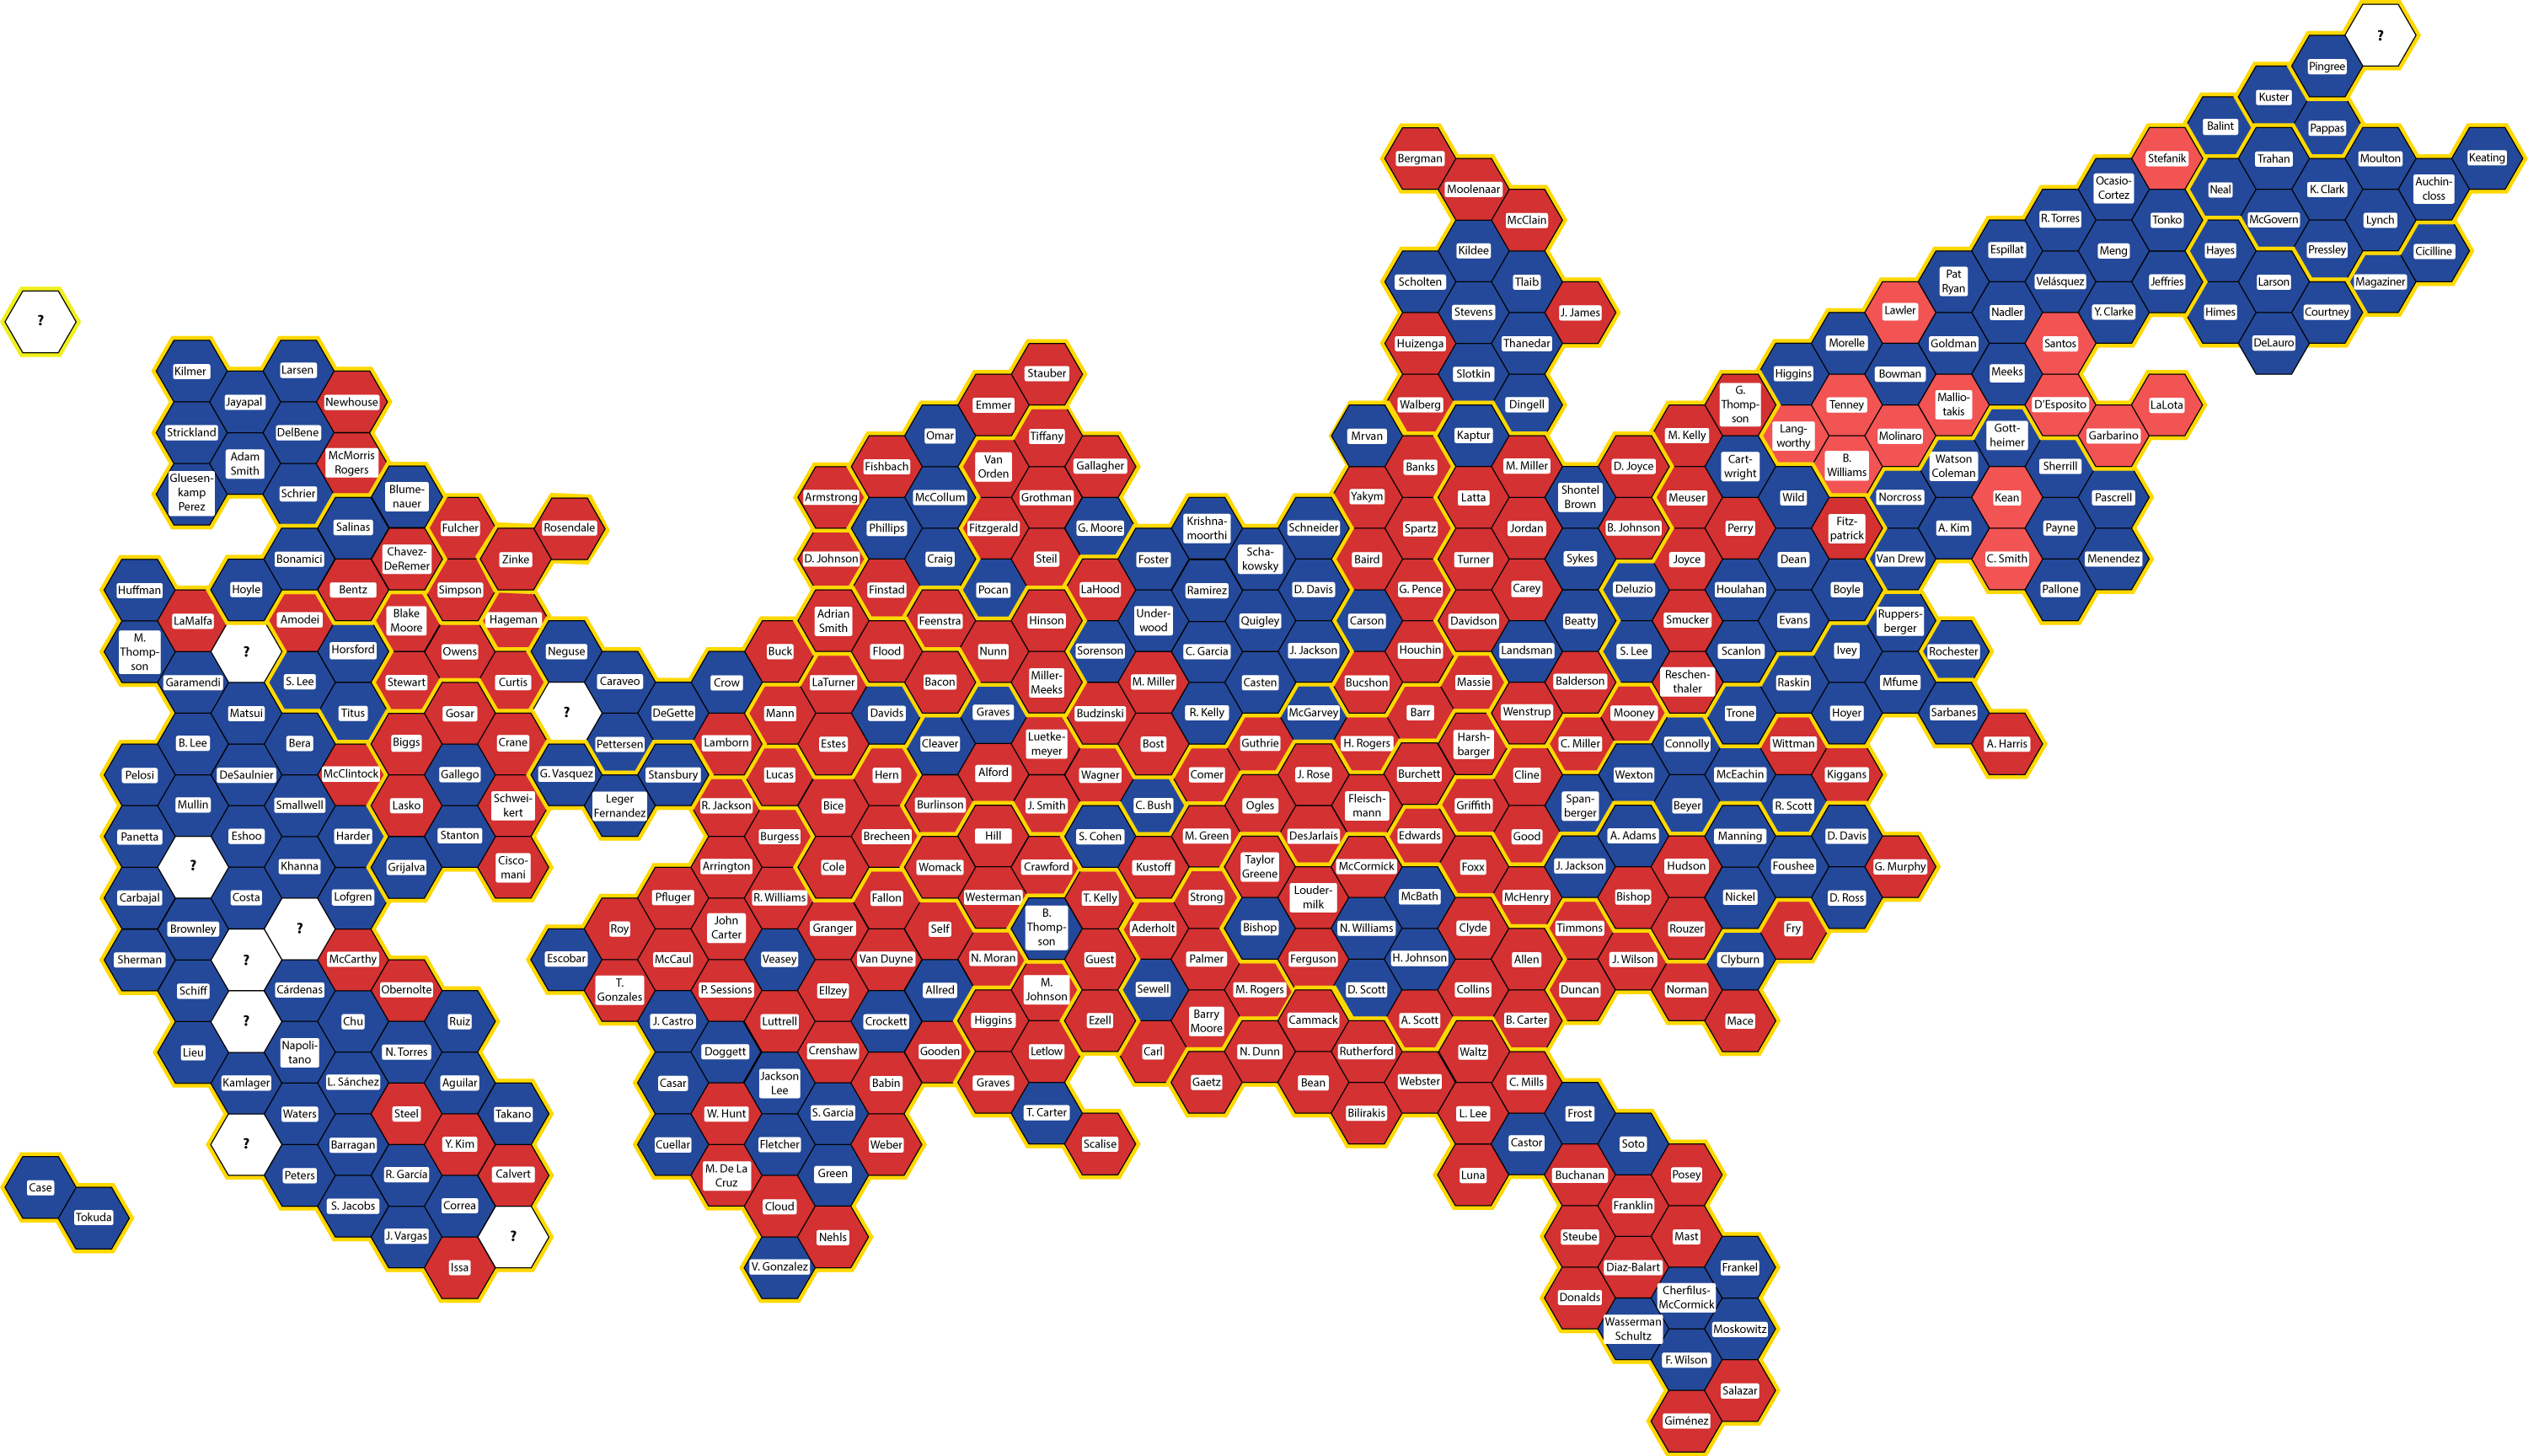
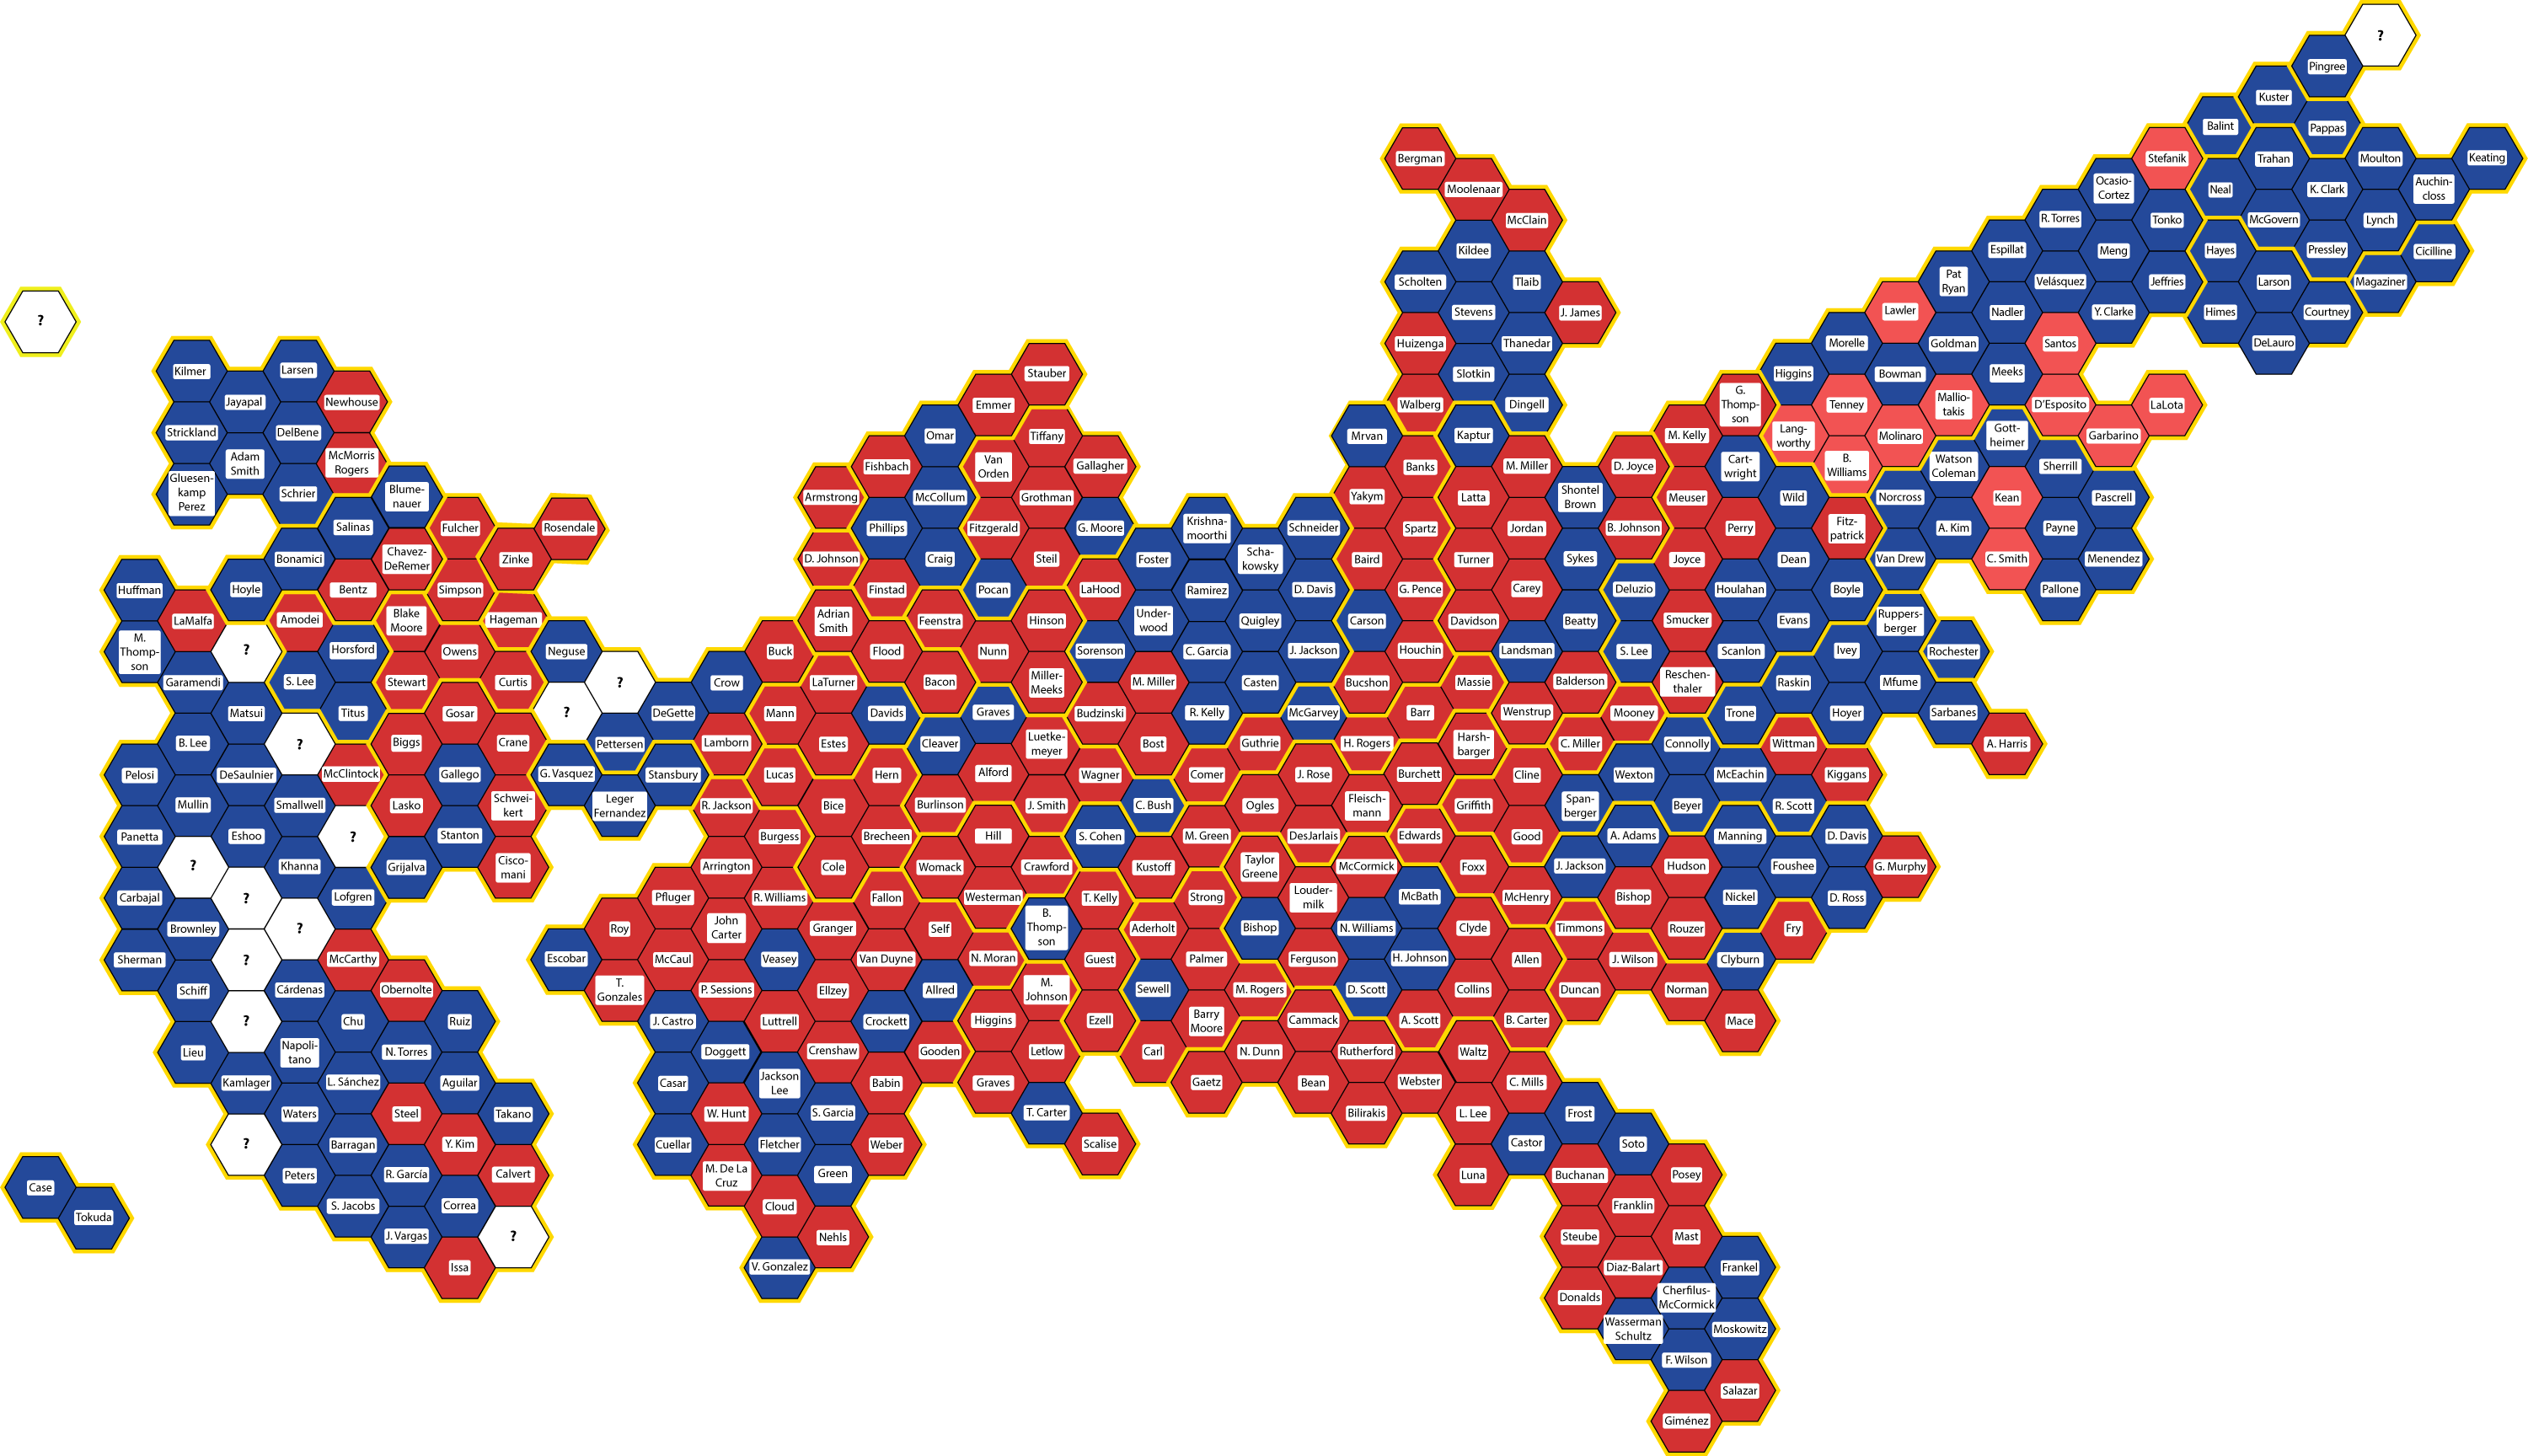
And here is the visualization:
Red = Republican
Blue = Democratic
White = party undecided
Click for a full-size version.
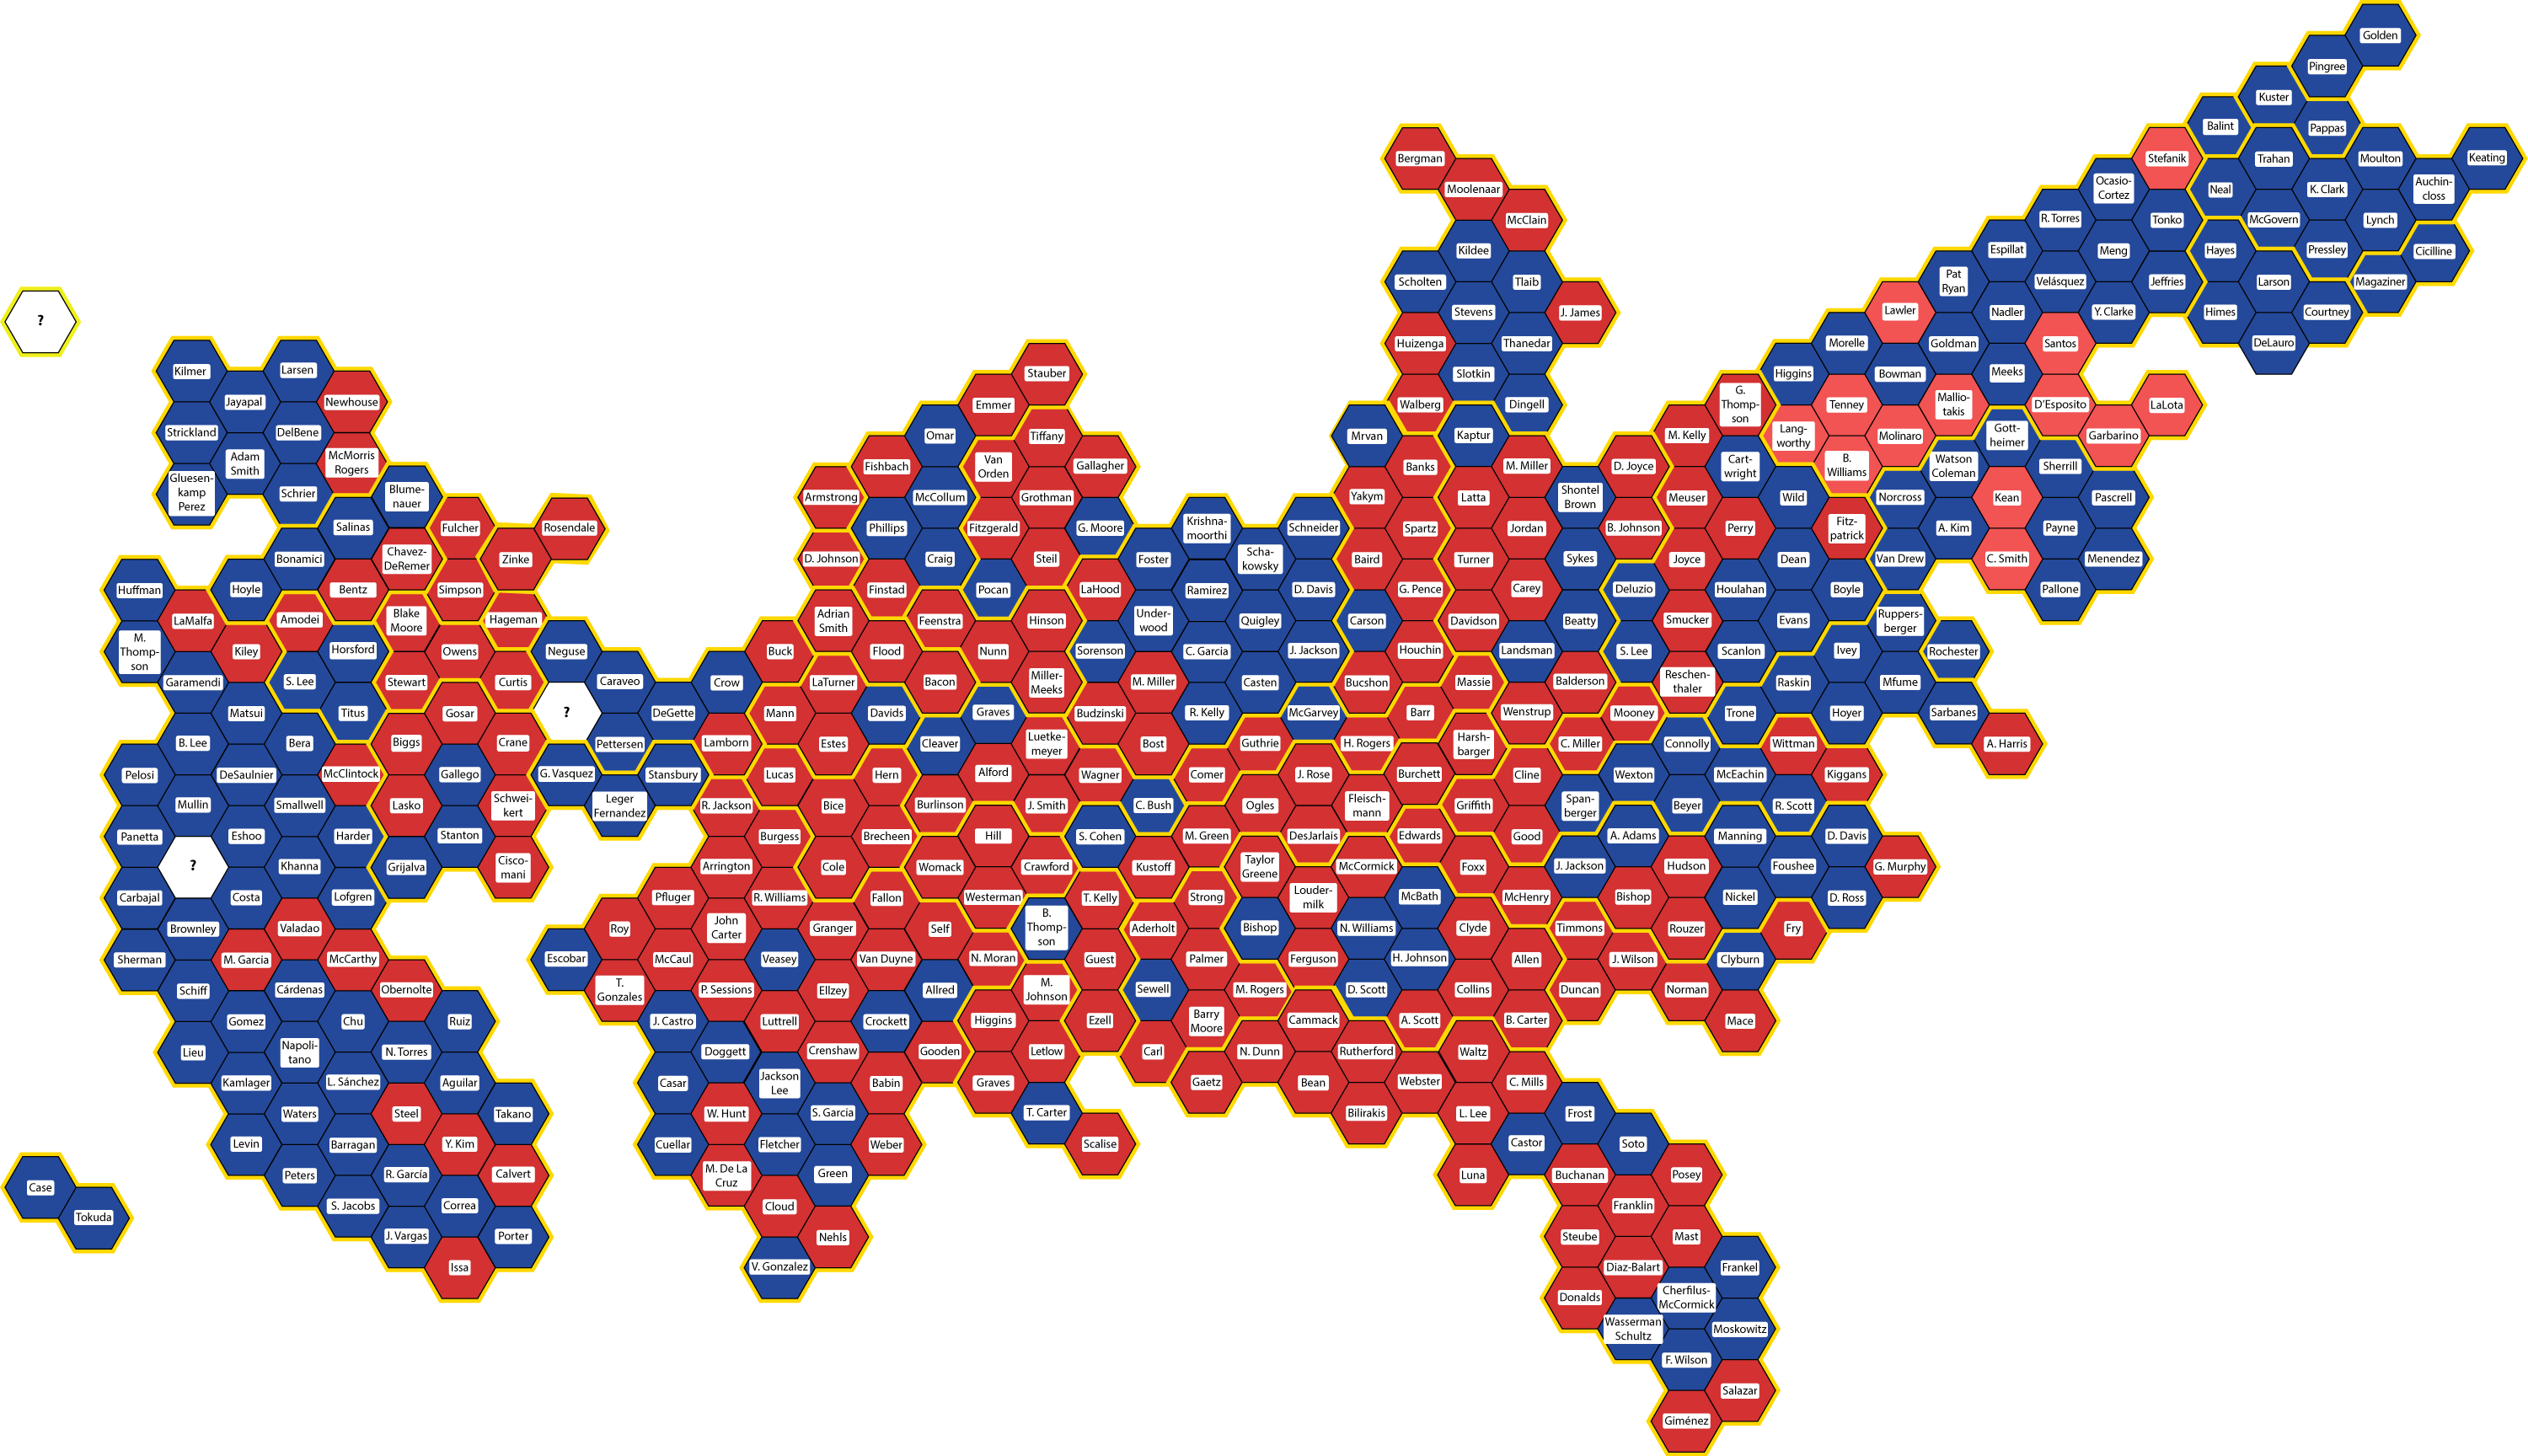
Results we have learned since last time:
California-3: Republican state assembly member Kevin Kiley
California-22: Republican incumbent David Valadao
California-34: Democratic incumbent Jimmy Gomez
California-47: Democratic incumbent Katie Porter
Still undecided:
Alaska at large: the entire state
California-13: Merced and surrounding areas
Colorado-3: Pueblo, Grand Junction, and the rural western third of the state
And I now have a Data Challenge from a random person on the Internet. He claims that there was no excess mortality in Europe in 2020, but there has been excess mortality in 2022. (Excess mortality is defined as the number of annual deaths above the baseline for the previous several years.) Since there was a global pandemic in 2020 that has abated by 2022, that seems crazy – but I can test the idea myself. I’m now getting the data from the European Mortality Monitoring program (EuroMOMO) of the European Centers for Disease Control.
I’ll let you know what I find.
Thanks for reading, and here’s to many more years of gratitude!