Graphs day 139, pandemic day 146, day 216 since the first cases were diagnosed.
Not just an incremental update today, I’ve got a whole new way of looking at the data.
Total cases of COVID-19 diagnosed worldwide: 18,079,126
Total deaths: 689,347
Everything we have seen so far has been at the level of entire countries or entire states (or in one case, the province of Hubei in China). But I also have county-level data for the United States, so we can look in grater detail at areas smaller than state or country. In particular, we can look at some places that have been identified as “hot zones” – areas with particularly high case rates. The regions we’ll look at today are:
New York City, Miami, Houston, Phoenix, Orlando, Hubei, Italy, Brazil
For the areas in the United States, what we’re looking at is metropolitan statistical area (MSAs), which usually consists of several counties around the core city. Wikipedia’s List of metropolitan statistical areas shows which counties are included in which MSAs.
So how does the pattern of cases look in each of these “hot zone” areas?
The graph is below. The graph is on the “Qatar scale,” which runs from zero to 700 cases per million people. Each region gets a unique color and is labeled close to the line with the same color. The label also gives the mortality rate (cumulative deaths per million people) in the region – cumulative because the dead stay dead. The thickness of the lines and the size of the labels depend on the cumulative case fatality rate – the number of people who died divided by the number diagnosed.
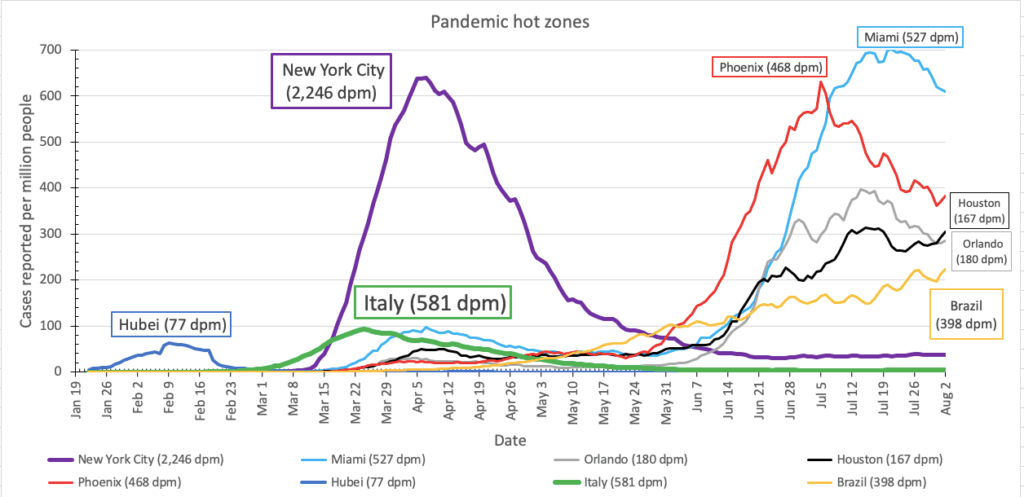
Two observations:
- The worst case rates have been in Miami, but the worst death rates have been in New York City
- For all the early news coverage of China, Italy, and Brazil, the areas that have been hardest hit so far are all in the United States. Key word: so far.
Want to try these graphs yourself? Go for it!!! I’ve updated my spreadsheet (still version 7) to restore the formulas. The upside is that you can now more easily make changes to make the graphs your own; the downside is that unless you are on a high-end computer, the calculations will be slooooooooooooooooow. To speed up calculations, replace formulas with values once you decide you have the right formulas. If you’re not sure how to do that, just ask – leave a comment, messenge me on social media, or send me an email at jordan.raddick@gmail.com.
Another update on the state of the pandemic tomorrow, and every day until the pandemic ends or I do. And more of the regular Monday-Wednesday-Friday posts, which are way more interesting anyway.