Graphs day 143, pandemic day 150, day 220 since the first cases were diagnosed.
I can’t believe it’s been CXLIII days and I haven’t made this joke yet, but let’s look at COVID-19 cases in Georgia. And Georgia.
But first, we hit another milestone number today:
Total cases of COVID-19 diagnosed worldwide: 19,097,149
Total deaths: 714,940
While COVID-19 continues to ravage Georgia, Georgia has mostly escaped the heavy toll of the disease so far. The graph below shows the number of cases reported per day in both places. The main graph is on the regular scale, from zero to 200 new cases diagnosed per day per million people. The smaller inset graph is on the “Qatar scale,” which runs from zero to 700 cases per million people. The label also gives the mortality rate (cumulative deaths per million people) in the region – cumulative because the dead stay dead. The thickness of the lines and the size of the labels depend on the cumulative case fatality rate – the number of people who died divided by the number diagnosed.
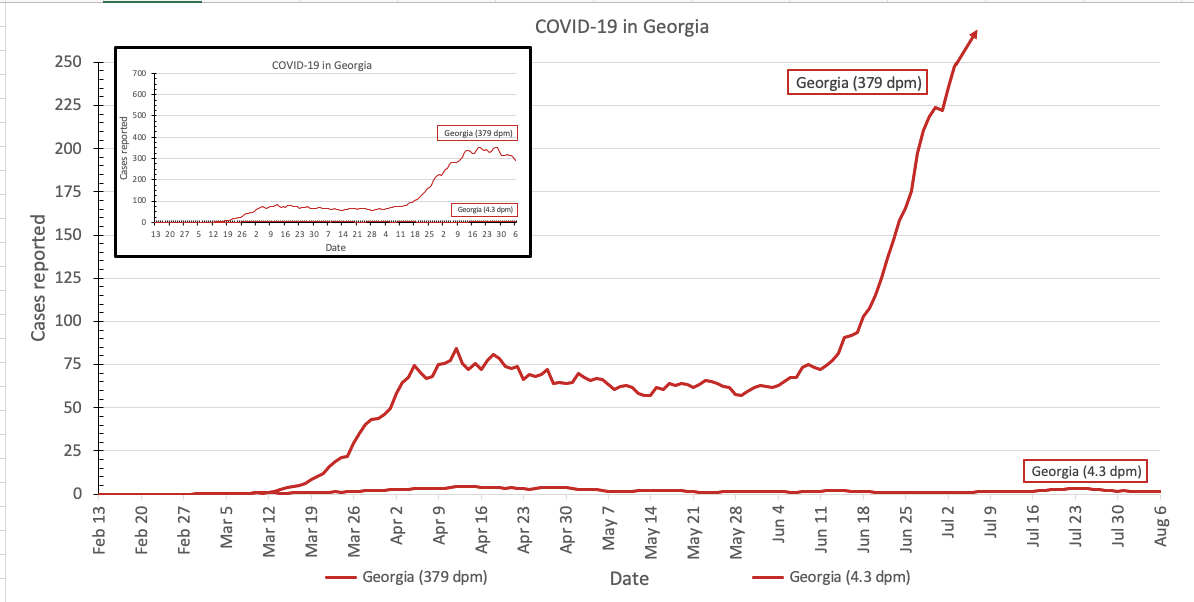
Which Georgia is which? You can probably guess.
Want to try these graphs yourself? Go for it!!!
I have updated my template spreadsheet to version 7.2 to include The Georgias, and also a special bonus graph I’ll show tomorrow. If you have questions about how to use it, please ask – leave a comment, messenge me on social media, or send me an email at jordan.raddick@gmail.com.
Another update on the state of the pandemic tomorrow, and every day until the pandemic ends or I do.