Graphs day 141, pandemic day 148, day 218 since the first cases were diagnosed.
I hope you enjoyed Rules for protest, in the style of Dr. Seuss – or at least found it an uncomfortably accurate depiction of current attitudes toward the racial justice protests all over the world.
Two months ago, I made a prediction that Earth would reach seven hundred thousand deaths on August 5, 2020. Here we are, it’s August 5th, and:
Total cases of COVID-19 diagnosed worldwide: 18,540,119
Total deaths: 700,647
I hate being right.
Beyond this successful prediction, a quick graph to update the high case rates the regions that I first showed on Monday:
New York City, Miami, Houston, Phoenix, Orlando, Hubei, Italy, Brazil
For the areas in the United States, what we’re looking at is metropolitan statistical area (MSAs), which usually consists of several counties around the core city. Wikipedia’s List of metropolitan statistical areas shows which counties are included in which MSAs. The graph is below. The graph is on the “Qatar scale,” which runs from zero to 700 cases per million people. Each region gets a unique color and is labeled close to the line with the same color. The label also gives the mortality rate (cumulative deaths per million people) in the region – cumulative because the dead stay dead. The thickness of the lines and the size of the labels depend on the cumulative case fatality rate – the number of people who died divided by the number diagnosed.
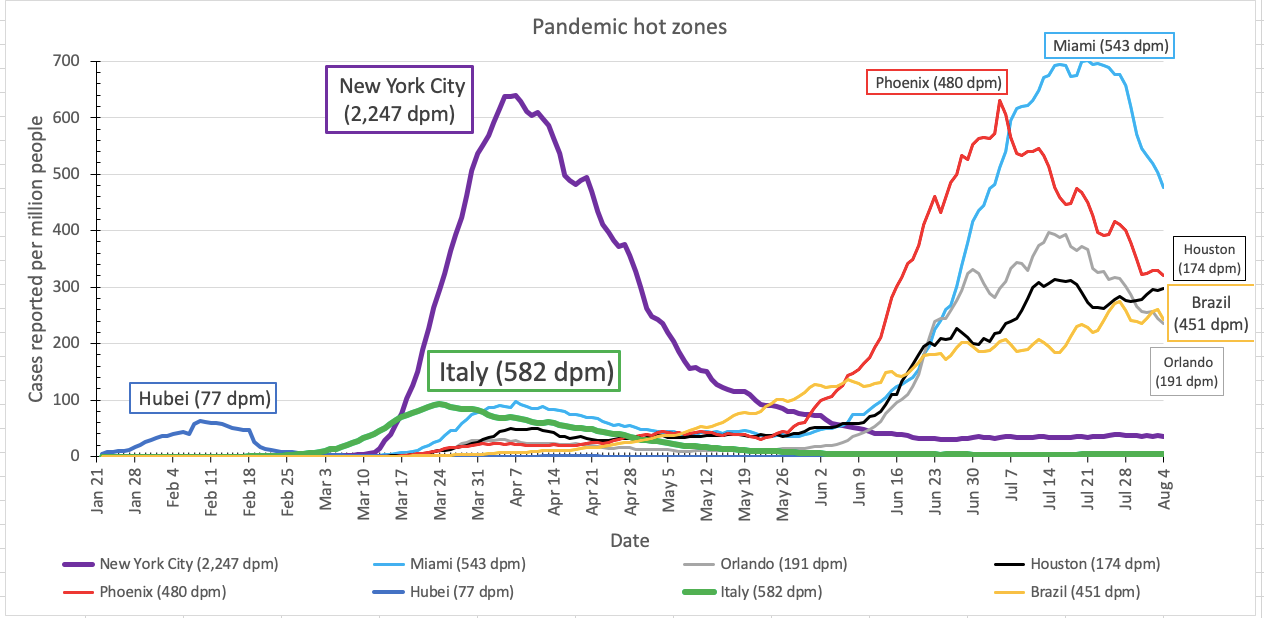
The precipitous drop in cases in Miami looks like good news, and it probably is. But keep in mind that testing centers in Florida were closed for a few days this week because of Hurricane Isaias. Cases had started to drop before that, so I think cases are really dropping – but not dropping as quickly as it appears from this graph.
Want to try these graphs yourself? Go for it!!!
I have updated my template spreadsheet to version 7.1. If you have questions about how to use it, please ask – leave a comment, messenge me on social media, or send me an email at jordan.raddick@gmail.com.
Another update on the state of the pandemic tomorrow, and every day until the pandemic ends or I do.