It’s been fun using maps to track current polling for the 2020 U.S. Presidential election. But there’s a lot more to our democracy than just the President. Because each state’s electoral votes are equal to the number of senators plus representatives, it’s easy to go to from elected legislators to Presidential electoral votes. Or the other way around. And so it’s easy to turn a map of electoral votes into a map of Senators.
And so. The map below is organized roughly-geographically, and shows the Senators from each state by name. Roses Republican Senators are red, violets Democratic Senators are blue, and light bluie shows the two independent Senators, Bernie Sanders (I-VT) and Angus King (I-ME), both of whom caucus with the Democratic Senators.
It’s hard to see the names in the regular-size map below, so click on it to see a larger version.
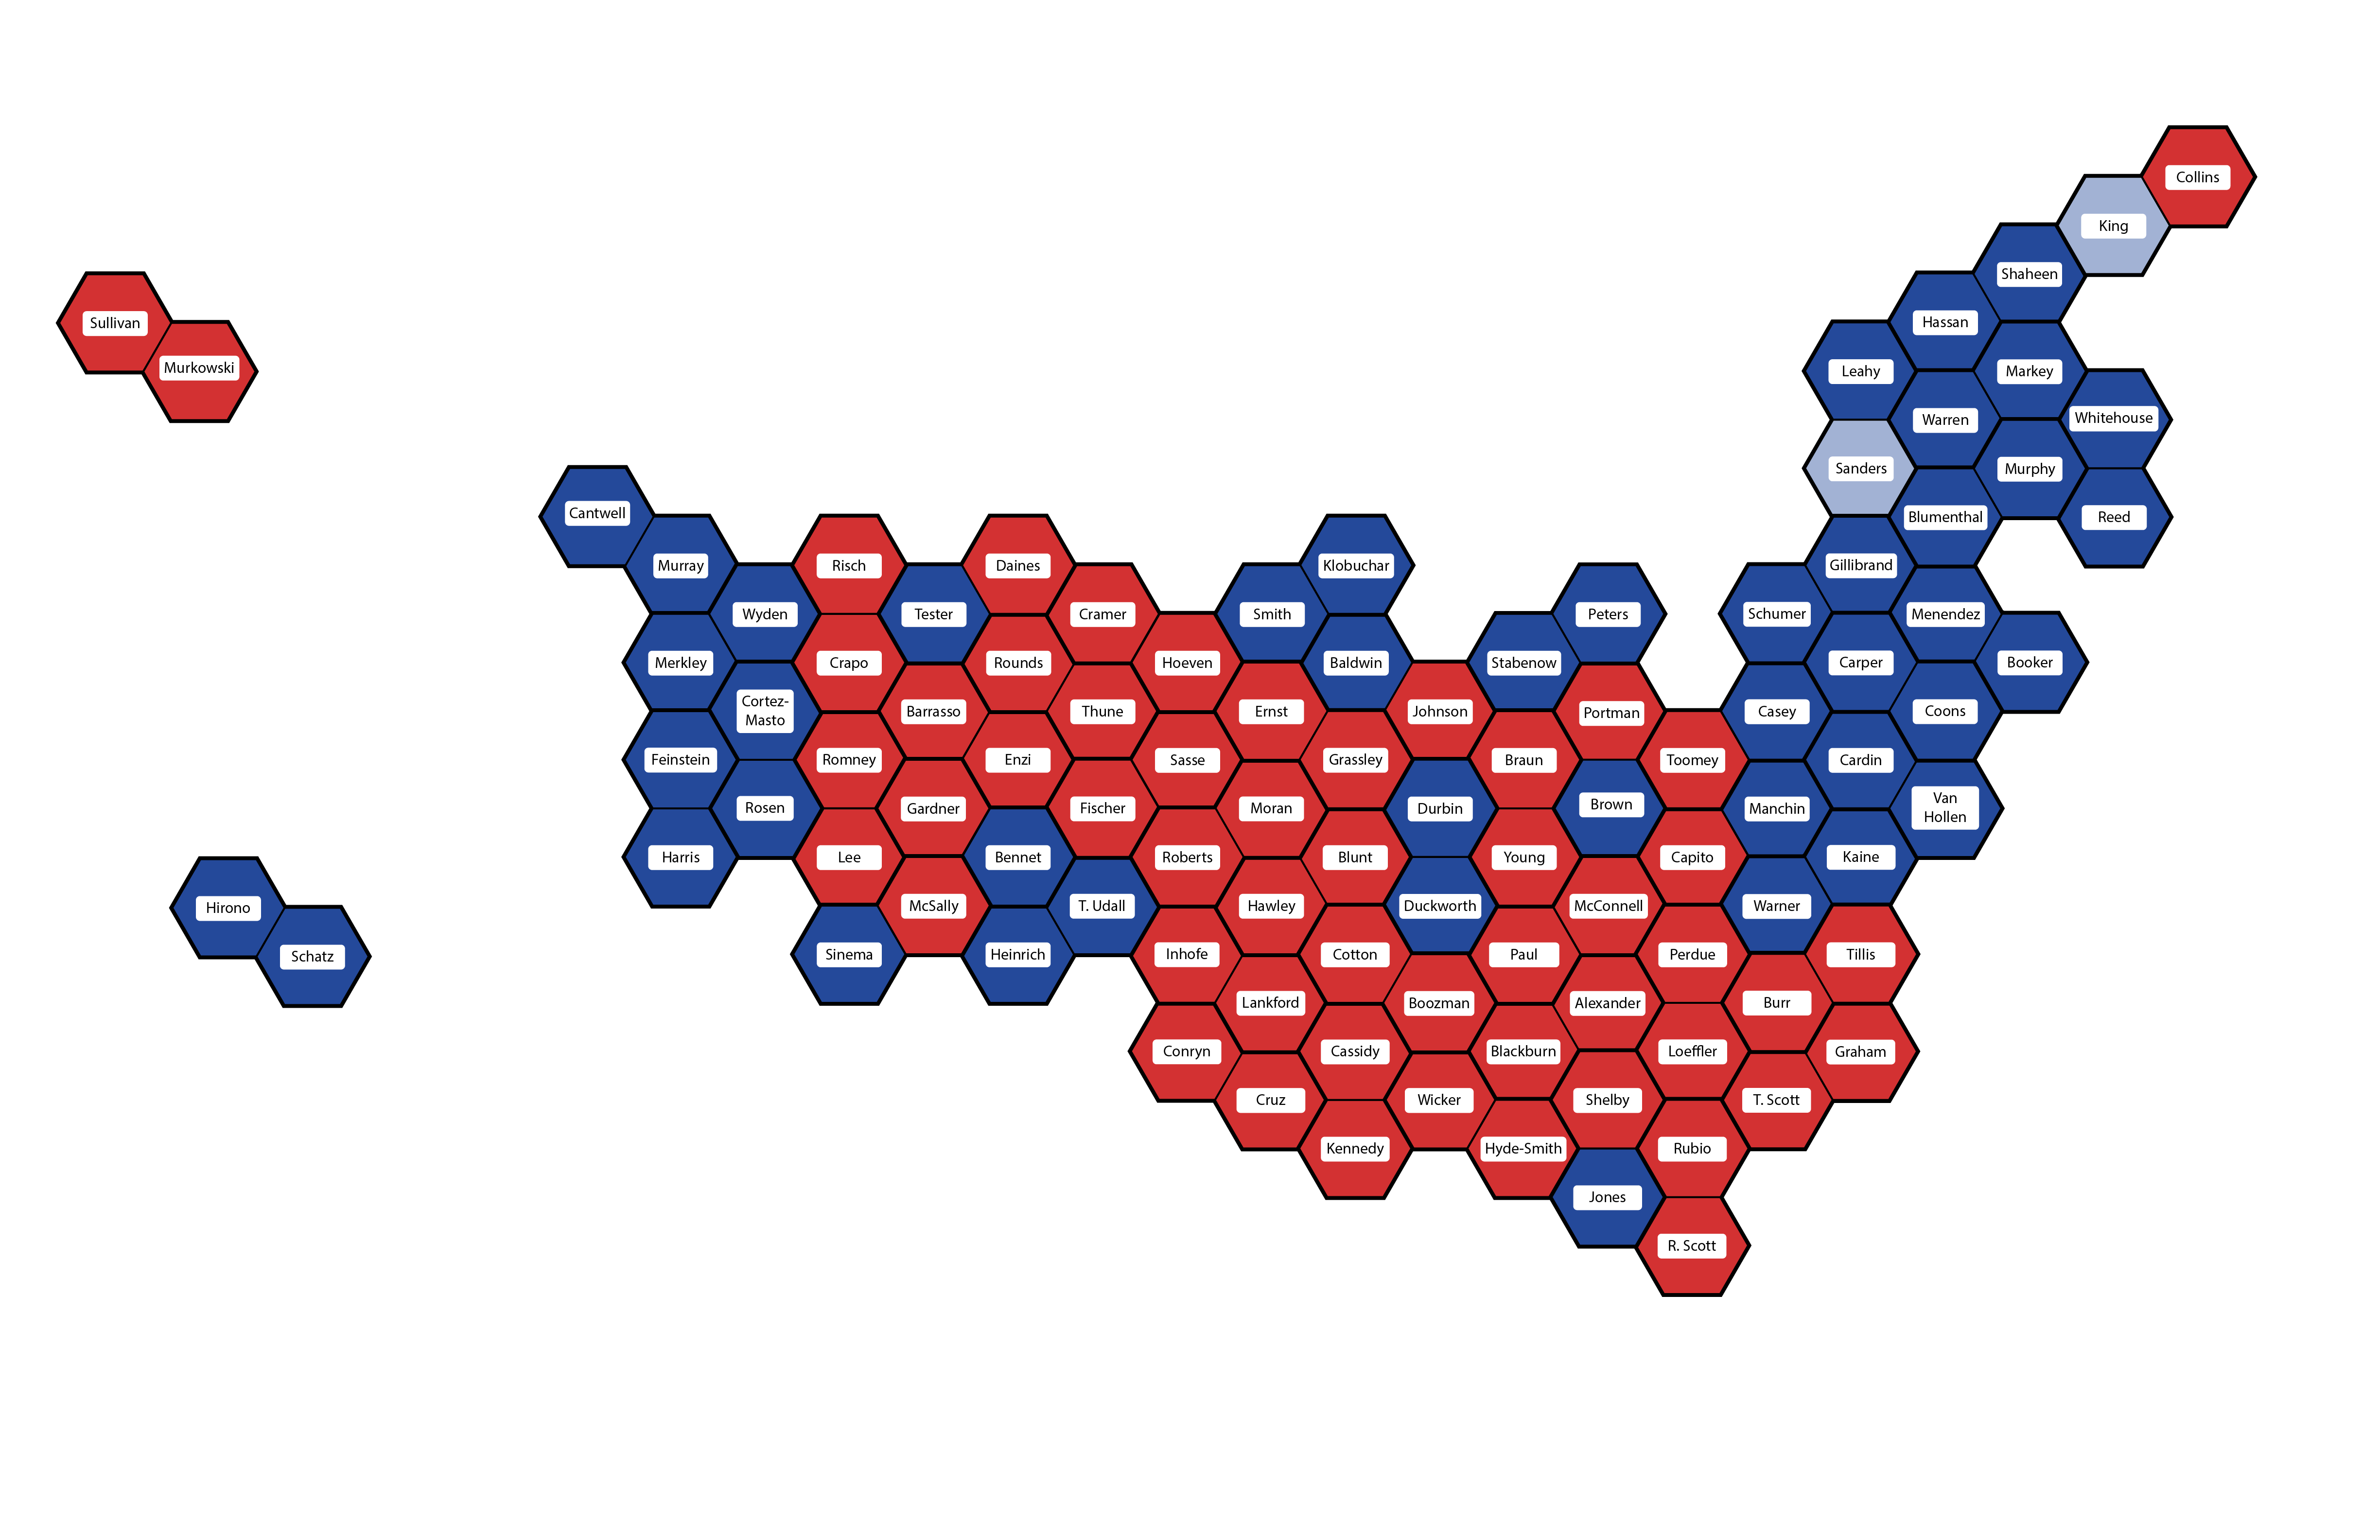
Looking at Senators displayed on a map like this, with equal importance given to all states and thematic geography, shows how the rules of the Senate exacerbate the urban/rural differences that keep us divided.
Every state has both urban and rural areas, but states with similar urban/rural percentages tend to cluster together: more urban on the east coast, west coast, and the western side of the Great Lakes, and more rural everywhere else. That, combined with the traditional yet 1000% arbitrary red-and-blue color scheme results in a map with large stretches of red and large stretches of blue. Look how lonely Doug Jones (D-AL) and Susan Collins (R-ME) are as the sole members of their parties for miles around.
I’ll be using this map for many purposes in the future, starting with making predictions for the 2020 Senate election… soon. I need to look at the polls in a lot more data. That was a typo, I meant “look at the polls in a lot more detail,” but honestly “look at the polls in a lot more data” is way better. But first…
You can probably guess what’s coming on Friday, and why it’s 4.35 times more work.
One thought on “Mapping Democracy: The U.S. Senate”
Comments are closed.