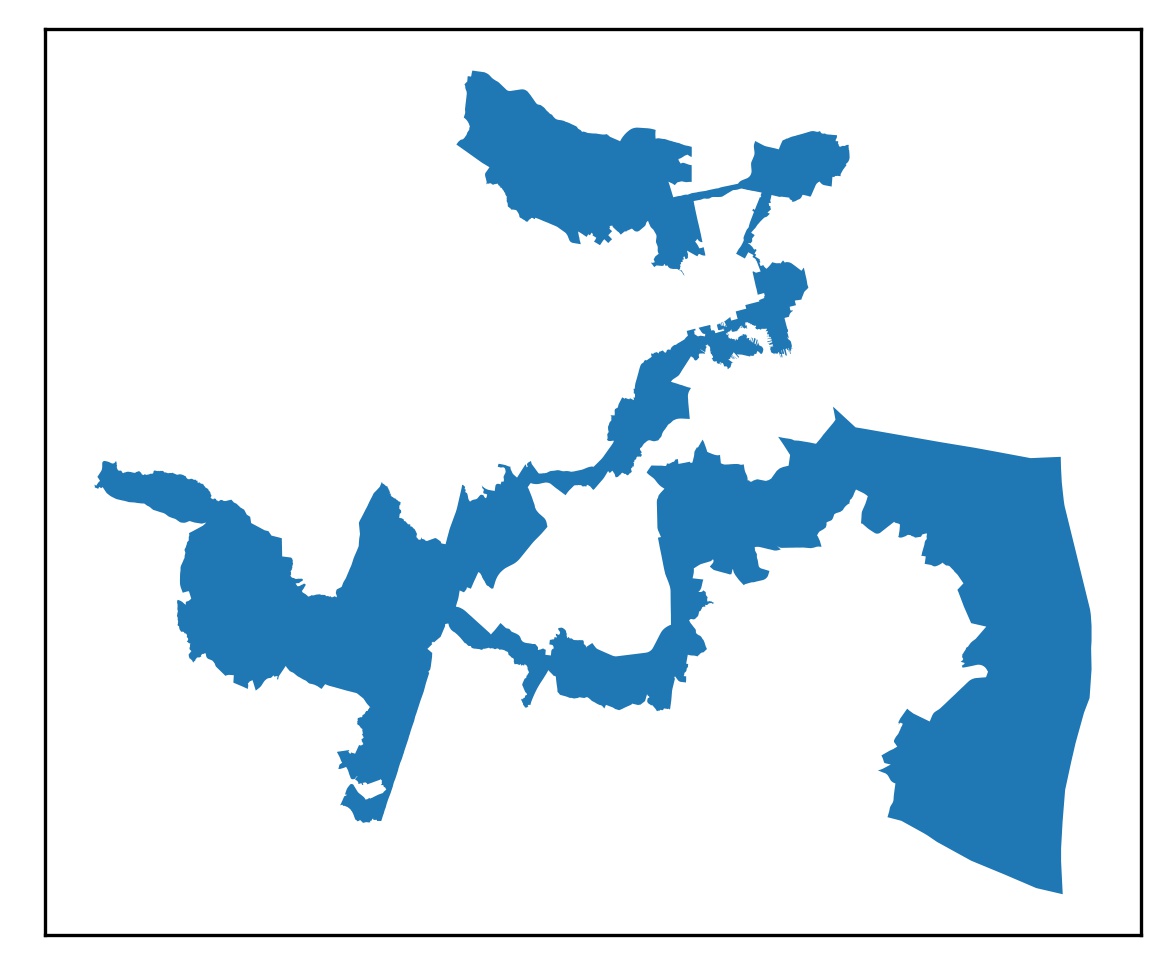
On Monday, we began a deep dive into gerrymandering – the practice of designing electoral districts to provide an advantage of some political party or other group. We looked at a few districts with particularly crazy shapes, including the salamanderiest district in the entire United States – Maryland’s 3rd Congressional District. But how can we say which districts are more or less gerrymandered?
There are multiple ways to measure how gerrymandered a district is, and we’ll explore several of them over the course of this series. But we’ll start here with one of the simplest, a method that requires only the shape of the district: the Polsby-Popper (PP) score.
The Polsby-Popper score was invented in 1991 by American law professors Daniel Polsby and Robert Popper, although it is closely related to concepts known to mathematicians for decades (the coastline paradox) or millennia (the isoperimetric inequality). The PP score works not just for electoral districts, but for any shape. The formula is simply the area of the shape divided by the perimeter (the distance around) squared, all multiplied by 4Ï€.
Essentially, the PP score measures how circle-like a shape is. Some examples will help make sense of what the formula measures – and only the most high-tech mathematical figures will do here.
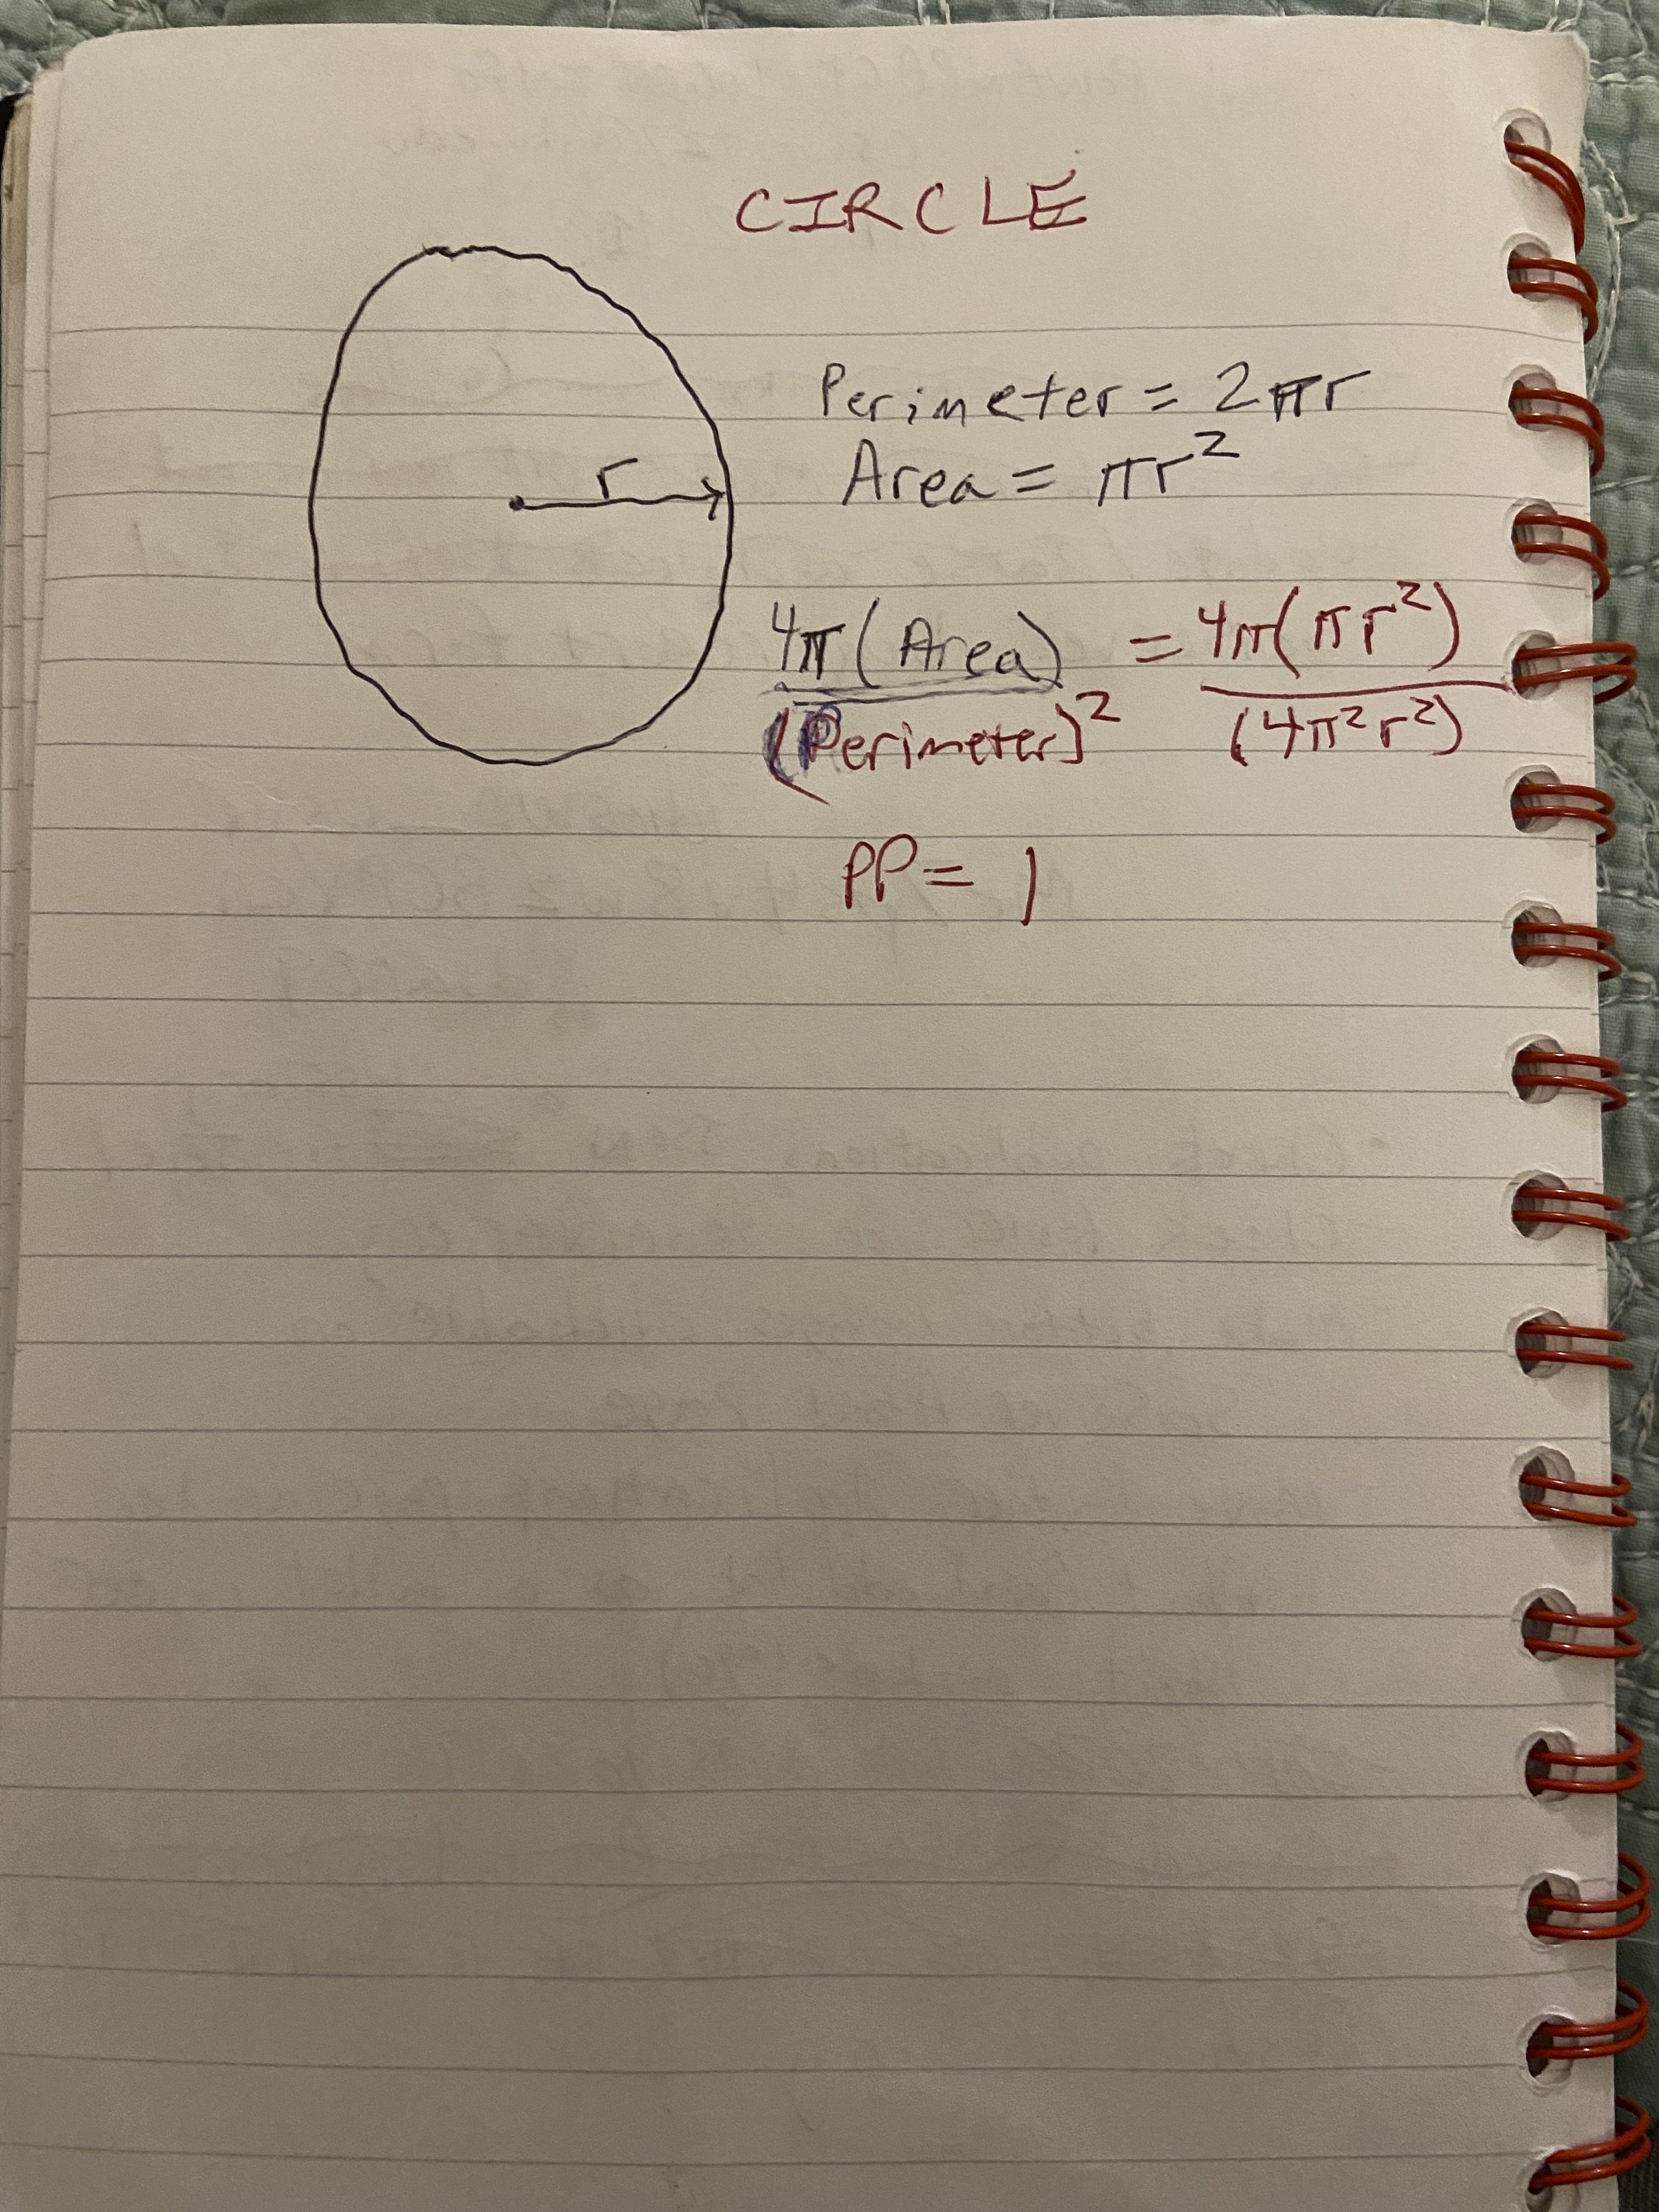
The first figure shows an imaginary district that is a perfect circle. The area of a circle is π times the radius; the perimeter (circumference) is 2π times the radius. Going through the formula, the radius cancels out, leaving 4π / 4π, which is 1. There are two extremely important points here. First, the PP score for a circle is 1, which is the highest possible value. The PP score will always be a number between 0 and 1. The more gerrymandered a district is, the lower the PP score.
Second, since the radius cancels, the size of the circle doesn’t matter. The circle in question could be a fly’s egg, or the Sun, and it wouldn’t matter, the PP score is the same. And it turns out that is the size of the district will always cancel.
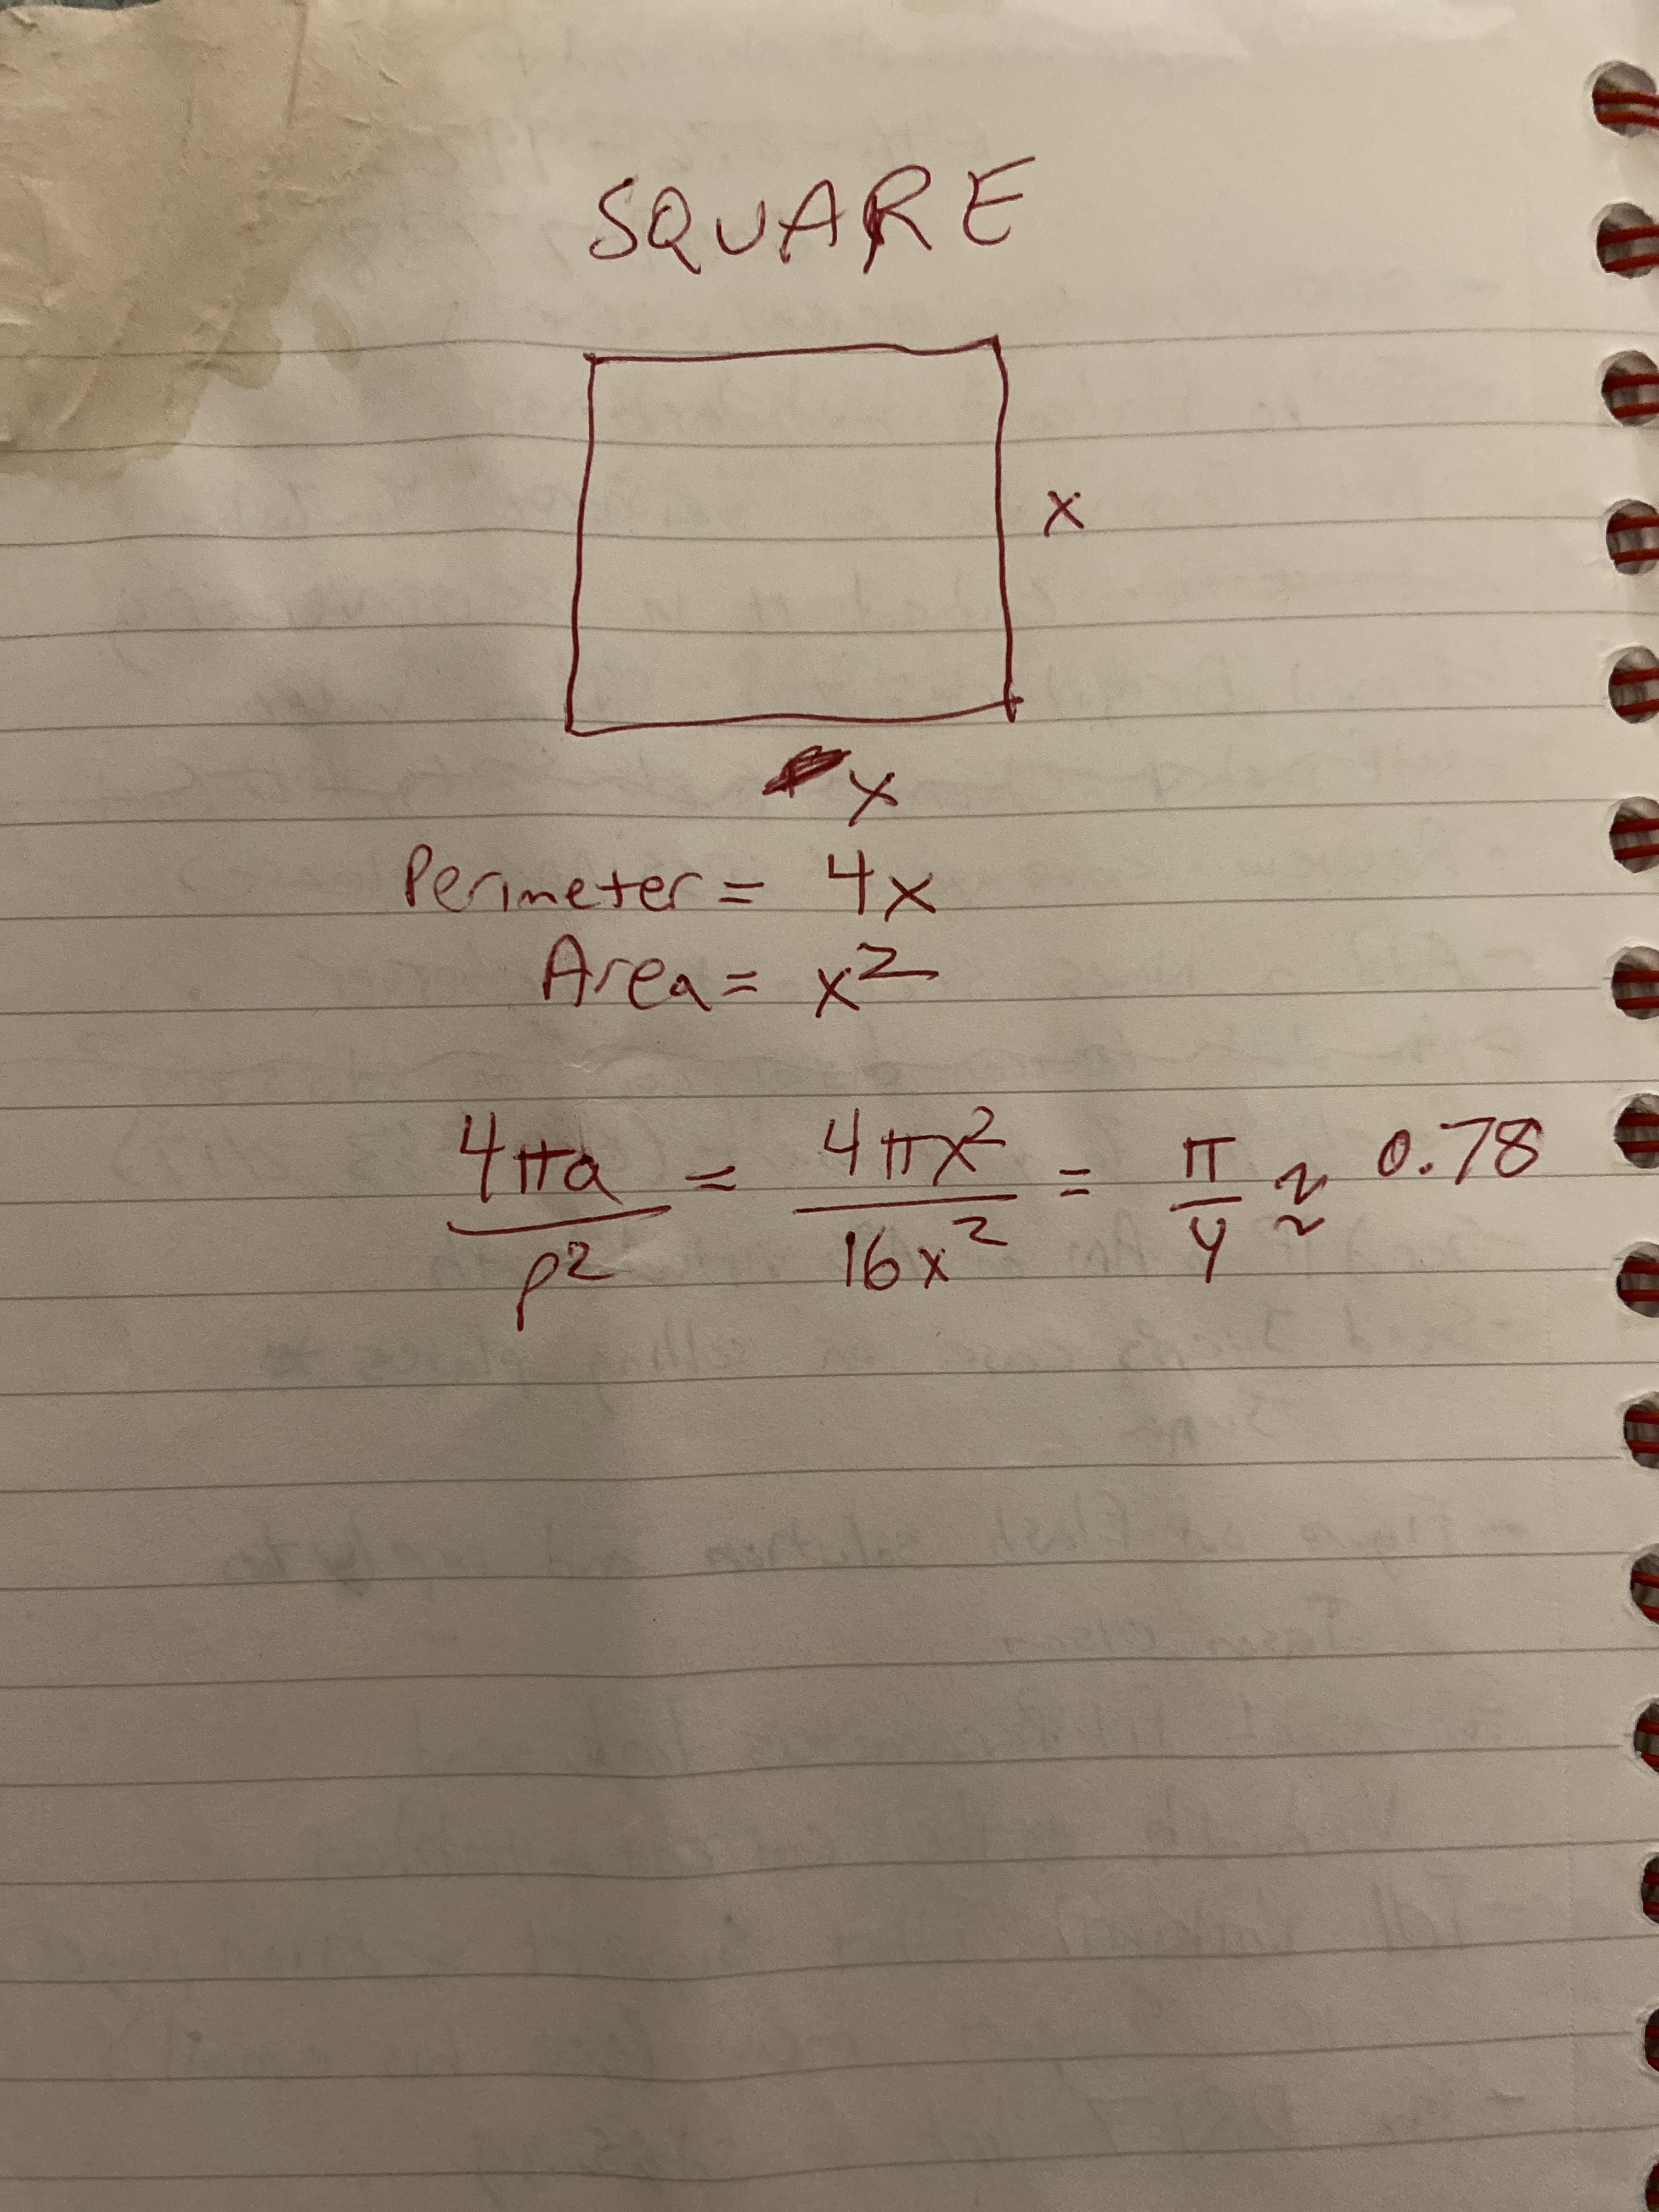
What about other district shapes? What is the PP score for a square? Take a look at this illustration plus equations. If x is the side length of a square, the perimeter of the square is 4x; the area is x2. And so the PP score for a square is Ï€/4, approximately equal to 0.78. That makes sense – a square is not as round as a circle.
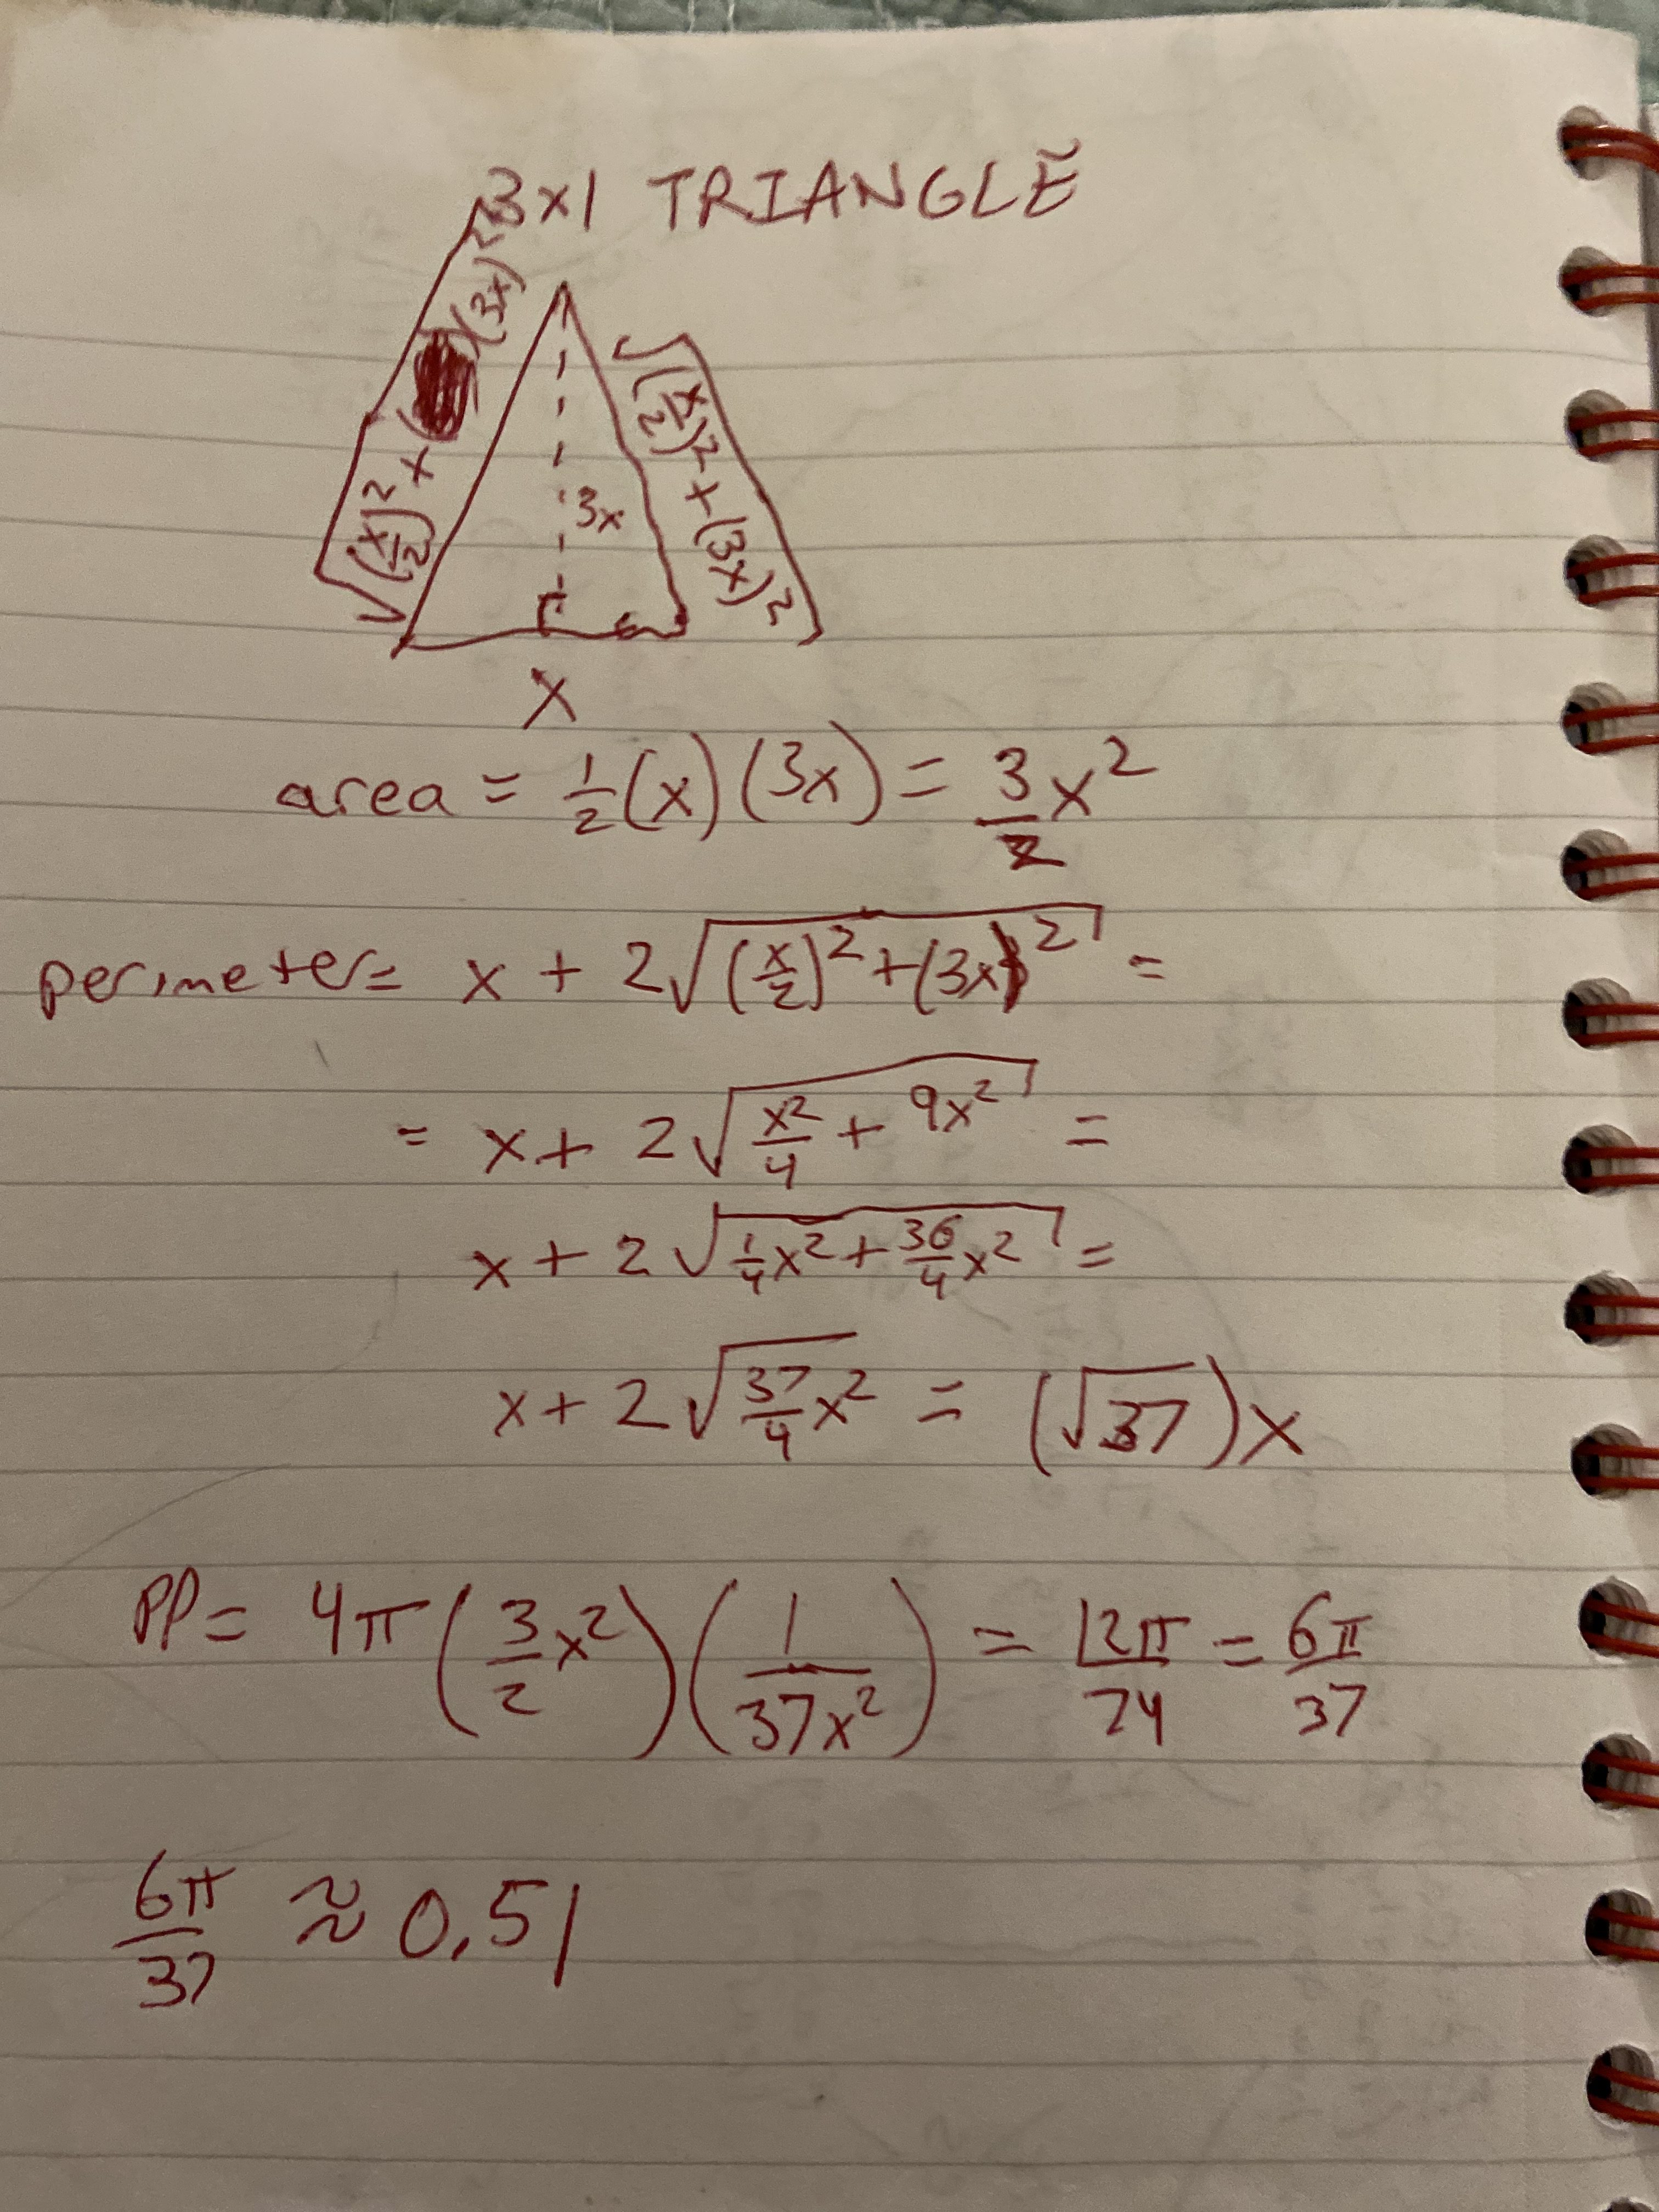
Let’s try one more shape – a triangle that is three times higher than it is wide. Before I show the math, make a prediction: will the 3-by-1 triangle have a higher or lower PP score than the square?
The math is in the image, but the answer is about 0.51. That is less than either the square or the circle.
So what are the PP scores for the actual shapes of actual U.S. Congressional districts? This was the time I was going to tell you…. but I realized I made a mistake with the calculations. I calculated the PP scores in geographic latitude/longitude coordinates, which assume that the shapes are on a flat plane. But the Earth is not a flat plane; the districts sit on the surface of a sphere. It might not make a difference, but it might. More on Friday.
Your article helped me a lot, is there any more related content? Thanks!