I closed Monday’s review of my House predictions with an observation that I amazingly haven’t seen anyone else make: the Republicans actually came very close to capturing control of the House of Representatives. How close?
The current seat count in the U.S. House of Representatives is Democratic 220, Republican 202 – likely to go up to Republican 205 once the final three seats are decided. That means that if eight elections had gone Republican instead, the count would be Republican 213 Democratic 212.
The table below shows the eight closest races in which the Democratic candidate won. Adding up all the margins gives the minimum number of extra Republican votes that would have been required to give control of the House to the Republicans – provided of course all the votes had come in exactly the right places.
District
Democratic
D votes
Republican
R votes
Margin
Pct margin
IL-14
Underwood
203,195
Oberweis
197,818
5,377
1.3%
IA-3
Axne
219,205
Young
212,997
6,208
1.4%
VA-7
Spanberger
230,893
Freitas
222,623
8,270
1.8%
PA-17
Lamb
221,547
Parnell
211,951
9,596
2.2%
WI-3
Kind
199,870
Van Orden
189,524
10,346
2.7%
MN-2
Craig
204,031
Kistner
194,466
9,565
2.4%
MI-11
Stevens
226,128
Esshaki
215,405
10,723
2.4%
TX-15
V. Gonzalez
115,594
De La Cruz-Hernandez
109,005
6,589
2.9%
The eight closest races with a Democratic winner
The final count: 66,674. That’s not very many voters.
As happens every even-numbered year, all 435 seats in the House of Representatives were up for a vote. I predicted the outcomes of them all on a map, and discussed detailed predictions in part 2 and part 3). How did I do in predicting the results of those elections?
What We Still Don’t Know
The answer is, “we don’t know for sure yet,” because there are four results still unknown.
The weird one
Louisiana-5: As with the two Senate Elections in Georgia, we don’t know the winner in Louisiana’s 5th congressional district, which covers the whole northeastern quarter of the state and includes Monroe and Alexandria. Like Georgia, Louisiana uses a “jungle primary” system where all candidates appear on the ballot regardless of party. If one candidate gets 50 percent of the vote, they win the election; if not, the top two candidates face off in a runoff. The top two finishers were Republicans Luke Letlow (33.1% election day vote share) and Lance Harris (16.6%), leaving us in the weird position of knowing that a Republican will represent LA-5, but we still don’t know which one.
The exciting ones
And there are also three house races where both winner is still unknown, and might be from either major party:
California-21 (the southern third of the Central Valley and the east side of Bakersfield): with 95 percent of ballots counted, Republican former representative David Valadao (83,564 votes; 50.5%) leads Democratic incumbent T.J. Cox (81,946; 49.5%). CURRENT RESULTS
California-25 (rural-ish Los Angeles and Ventura Counties, including Palmdale, Santa Clarita, and the San Fernando Valley): with 87 percent of ballots counted, Republican incumbent Mike Garcia (169,060 votes; 50.1%) leads his former special election Democratic opponent Christy Smith (168,660; 49.9%). That’s a difference of just 400 votes, smaller than my high school graduating class. CURRENT RESULTS
Iowa-2 (the southeastern quarter of Iowa, including Davenport and Iowa City): the most mind-blowing one of all… with all votes counted and currently being recounted by hand, Republican Marianette Miller-Meeks (196,862 votes; 50.006%) leads Democratic candidate Rita Hart (196,815; 49.994%) BY JUST 47 VOTES. That’s literally less people than would fit on a single bus! CURRENT RESULTS
Iowa’s second district race is headed to a recount, but recounts almost never change election results, so the most likely outcome is a ridiculously narrow win by Miller-Meeks. What is especially remarkable about this race is that neither I nor anyone else had this on our radar as a close race; Hart was expected to win easily. But so it always goes on election night – there is always at least one race that defies expectations. That’s the nature of trying to predict 435 different things; enough opportunities for outcomes to occur virtually guarantees that there will be a rare outcome somewhere, somehow.
So there are those four uncertainties, but that still leaves 431 certainties. How did I do in my predictions?
Hits and Misses
My top line result for the House of Representatives was that the party count would be a good result for the Democratic Party: 237 seats going Democratic and 198 Republican, for a net swing of five seats Democratic.
In reality, the Democratic majority remains, but the House elections feel very much like a win for the Republicans. Not including the three seats yet to be decided, the count is 230 Democratic, 202 Republican. Republicans have a narrow lead in all three undecided races, meaning the result most likely result is a swing of seven seats in favor of the Republicans.
I have some ideas about why the 2020 House and Senate elections were so good to the Republicans, but that’s a topic for a different post. What matters here is: how right or wrong were my predictions? And for evaluating my predictions, the important question is not the swing, but rather the individual election results.
Here is my the map of the outcome of my predictions. Colors indicate the party of the winning candidate, using the traditional yet arbitrary red for Republican and blue for Democratic. Districts whose calls I missed are shown with their winner’s name in BIG BOLD ALL-CAPS.
Checking my predictions for the 2020 U.S. House of Representatives elections. Click for a larger version.
The map shows that my predictions were correct for 417 of the 432 decided House seats. That’s a 96.5 percent success rate, although it’s less impressive than it sounds when you realize how gerrymandering has made most House elections completely uncompetitive. It’s also less impressive when you realize the systematic offset: I mistakenly predicted one Republican win in a seat that went Democratic, and FOURTEEN Democratic wins in seats that went Republican. If Garcia holds on in California-25 and Miller-Meeks in Iowa-2, the latter number goes up to SIXTEEN.
Here are the districts where I got it wrong. Click the district names to see the district’s Wikipedia page, which includes a map; click on RESULTS see the results from the most official source I could find (and many thanks to the websites of the Secretaries of State of California and Utah for making their official state counts so easy to find and link to):
California-39 (eastern suburbs of LA, including Fullerton and Yorba Linda): Republican state assembly woman Young Kim (173,312 votes; 50.6 percent vote share) defeated Democratic incumbent Gil Cisneros (169,089; 49.4 percent). RESULTS
California-48 (coastal Orange County, including Huntington Beach and Laguna Beach): Republican county councilwoman Michelle Steel (201,660 votes; 51.1 percent vote share) defeated Democratic incumbent Harley Rouda (193,305; 48.9 percent). RESULTS
Colorado-3 (the western half of Colorado, including Aspen, Grand Junction, and Pueblo): Republican bar owner and gun rights acitvist Lauren Boebert (220,502 votes; 51.4 percent vote share) defeated Democratic state representative Diane Mitsch Bush (193,980; 45.2 percent). RESULTS
Florida-26 (southern Miami-Dade County and the Florida Keys, including Homestead and Key West): Carlos Gimenez, the Republican county commissioner of Miami-Dade County (177,223 votes; 51.7 percent vote share) defeated Democratic incumbent Debbie Murcasel-Powell (165,407; 48.3 percent). RESULTS
Florida–27 (cities of Miami, Miami Beach, and Coral Gables): in another race that was absolutely not at all on anyone’s radar, Spanish-language TV news host Maria Elvira Salazar (176,141 votes; 51.4 percent vote share) shocked long-revered Democratic incumbent Donna Shalala (166,758 votes; 48.6 percent). The unexpected result, like Trump’s unexpected advantage in Miami-Dade County, is further evidence that that Trump’s messaging resonated in Miami. RESULTS
Georgia-7 (northeastern suburbs of Atlanta, including Duluth, Norcross, and Suwanee): The Democratic 2018 candidate, Professor Carolyn Bourdeaux (190,900 votes; 51.4 percent vote share) defeated emergency room doctor and Marine Corps veteran Rich McCormick (180,564; 48.6 percent). I predicted this race would be within-one-percent close, but I picked the wrong winner. It was the only race where I pick d a Republican and the seat went Democratic. RESULTS
Indiana-5 (city of Indianapolis and its northern suburbs, including Carmel and Marion): In another election I predicted would be within-one-percent close – but was not – Republican state senator Victoria Spartz (208,212 votes; 50.0 percent vote share) defeated Democratic former state representative Chrstina Hale (191,226; 45.9 percent). RESULTS
Iowa-1 (northeastern quarter of Iowa, including Cedar Rapids and Dubuque): in another race that I thought would not be at all competitive, I was blindsided by a loss for the Democratic incumbent. Republican former Cedar Rapids TV news anchor Ashley Hinson (212,088 votes; 51.3 percent vote share) defeated Abby Finkenauer (201,347; 48.7 percent). RESULTS
New Mexico-2 (the southern part of the state, including the southern part of Albuquerque, Las Cruces, and Roswell): a rematch of the 2018 election goes the other way, as Republican state representative Yvette Herrell (142,169 votes; 53.8 percent vote share) defeated Democratic incumbent Xochtil Torres Small (122,314; 46.3 percent) by a surprisingly large margin. RESULTS
New York-2 (the South Shore of Long Island, including Islip, Massapequa, and Ronkonkoma): New York state assemblyman Andrew Garbarino (164,272 votes; 56.4 percent vote share) won the election to replace the retiring senior Republican Peter King, by defeating Democratic challenger Jackie Gordon (124,071 votes; 42.6 percent). RESULTS
New York-11 (Staten Island and far southwestern Brooklyn): State assemblywoman Nicole Malliotakis (136,382 votes; 56.4 percent vote share) returned New York City’s most conservative district to Republican control, defeating one-term Democratic incumbent Max Rose (99,224 votes; 41.1 percent vote share). RESULTS
New York-22 (the bridge of the nose, including Binghamton and Utica): in a rematch of 2018 with a different result, Republican attorney and publisher Clauida Tenney (149,769 votes; 50.5 percent vote share) unseated Democratic incumbent Anthony Brindisi (140,644; 47.4 percent). RESULTS
Utah-4 (rural central Utah plus the southern edge of Salt Lake City because gerrymandering): As part of 2018’s “blue wave,” Ben McAdams made this the most Republican-leaning district with a Democratic representative – but like the Alabama Senate, it was always going to be tough to hold the seat. Republican candidate and former Jets and Raiders American football safety Burgess Owens (179,688 votes; 47.7 percent vote share) defeated McAdams (175,923; 46.7 percent). Someday I will look up former American football players in Congress and decide an all-star team, but this post is already long and is about to get longer. RESULTS
Margins of victory
District
Margin
NJ-7
1.2%
TX-24
1.3%
UT-4
-1.0%
CA-39
-1.2%
CA-48
-1.2%
MN-1
3.0%
TX-7
3.3%
NE-2
4.3%
AZ-6
4.4%
MI-3
6.0%
MO-2
6.4%
TX-21
6.5%
NC-8
6.6%
FL-26
-3.4%
TX-22
6.9%
OH-1
7.2%
NY-22
-3.8%
TX-23
-4.0%
IL-13
8.8%
AK
9.0%
GA-6
9.2%
AR-2
10.8%
MT
12.8%
MN-7
13.5%
MI-6
15.7%
NY-11
-15.8%
Elections I predicted would be close, and their actual margins
As I had discussed when I evaluated my Senate picks on Saturday, I predicted not only the winner of each contest, but also which would be close (within 5% vote share) and very close (within 1% vote share). How did I do?
I predicted that 26 races would be close – decided by a vote share of more than 1 percent but less than 5 percent. I looked up the actual vote share margin of those 26 races, defined as the percent vote share for the winning candidate minus that for the losing candidate. The table to the left (or above if you’re on a small screen) shows the results of those 26 races.
Because of votes for third-party candidates, the vote shares do not always add up to 100 percent; but that doesn’t matter because I only considered the difference. For a few of the close races I predicted, I missed not only the margin but also the winner. Those races are described in more detail in the Hits and Misses section above, and I somewhat arbitrarily decided to double the penalty for missing the margin. Of my 26 predicted close races…
NINE were actually close, decided by between 1 and 5 percent once I applied the double-penalty for picking the wrong winner. The one that I missed most hilariously was New York-11, described above, where I predicted a close win for Max Rose but Nicole Mallonakis won by a shocking 15.8 percent.
What about the races that I predicted would be very close, within one percent vote share or less? The table to the left (or below if you’re on a small screen) show the results.
District
Margin
CA-25
-0.2
CA-21
1
OK-5
4.2
VA-5
5.2
GA-7
-2.8
NJ-2
5.7
PA-10
6.6
IN-5
-4.1
CO-3
-6.2
NY-24
14.1
NY-2
-13.8
Elections I predited would be very close, and their actual margins
Of the 11 races that I predicted would be very close, two actually were very close – the two in California that are so close we don’t yet know who won. One more (OK-5) was within 5 percent. The other eight were decided by even more than 5 percent. Most hilariously wrong were the elections in NY-2 and NY-24, where I picked the wrong candidate, and the other candidate won by 13.8 percentage points.
Correctly calling of 26 close and 2 of 11 very close races is not great, but even that doesn’t tell the full story, because there were races that I did not expect to be close that turned out to be close. The most obvious example of a miss to that side was Iowa-1, where I picked incumbent Abby Finkenauer to win easily, but actually she lost by 3.6 percentage points. In addition to her and Donna Shalala in Florida-27 (who lost by 2.8 percentage points), there were an additional 17 where my predicted candidate won, but by less than 5 percentage points. Those unexpectedly close races are shown in the table below.
What do all 19 of these districts have in common? They were all occupied by Democratic representatives. Two of them have changed parties and are now represented by Republicans. The other 17, like the House as a whole, remain Democratic, but by a much smaller margin than expected.
District
Margin
IA-2
-0.0
IL-14
1.4
IA-3
1.4
VA-7
1.8
PA-17
2.0
WI-3
2.0
MN-2
2.2
MI-11
2.4
TX-15
2.9
NV-3
3.0
AZ-1
3.2
MI-8
3.6
PA-8
3.6
WA-8
3.6
PA-7
3.8
IL-17
4.0
NV-4
4.9
FL-27
-2.8
IA-1
-3.6
Races that were unexpectedly close, with their actual margins
That was supposed to be the end of this post – an evaluation of how I did in predicting the 2020 House elections. Not great, but not bad for a first attempt. I’ll take it.
But this is not the end of this post, because in fact, doing this comparison has made me realize something that I hadn’t realized before, and I haven’t heard anyone else observe either: the Republicans came very close to winning the House. Once all the seats are decided, it looks like the balance of power will be Democratic 220, Republican 205. If eight elections had gone the other way, the balance would be Republican 213, Democratic 212.
How many additional Republican votes would it have required to swing the eight closest elections in their favor? Those are the districts in the second through ninth row of the table to. the right (or above if you’re on a small screen), from Illinois-14 to Texas-15. I’m calculating that number now, and I’ll let you know on Wednesday.
And if there is one ironclad rule in American elections, it’s that the President’s party suffers significant losses in Congress in the first midterm election. Which means that there is a good chance that the Republicans will control both houses of Congress in 2022. What impact would that have on our system?
Hang on folks, because I think I found a game-breaking glitch in democracy.
One year ago, this virus only infected bats and pangolins. Today, the President of the United States.
Well that was unexpected.
We got our October Surprise (TM) early this time. Just 25 hours into the month of October, at 1 AM ET on Friday, October 2nd, President Donald Trump announced on Twitter that he had tested positive for COVID-19.
Later the same day, he was reported to have started showing symptoms, although it is unclear when his symptoms began. By that night, he had been moved to Walter Reed Medical Center and placed on supplemental oxygen.
Today at 6:30 PM ET, Trump left Walter Reed Medical Center. I don’t think he’ll be back – not because he won’t need to go back, but rather because his medical staff is busy installing whatever is required to turn the White House into a hospital. If Trump’s condition worsens, the hospital will come to him.
And unfortunately, the typical trajectory of COVID-19 is for patients to improve for a few days and then get worse again. The up-and-down cycle continues until either the patient is healthy enough that they no longer need acute care, or they die. Obviously I hope for a quick, steady, and painless recovery for him and for everyone he may have infected – but I fear that is unlikely at best.
How this will affect the presidential election depends on how quickly Trump recovers, and how effectively his doctors can hide any relapses. We are seeing data only from the very first polls since Trump announced his diagnosis, and they seem to be heavily critical of Trump. For example, in a new Ipsos poll, 67 percent of registered voters agree with the statement, “If President Trump had taken coronavirus/COVID-19 more seriously, he probably would not have been infected with the coronavirus/COVID-19.” Considering how incredibly difficult it is to get 67 percent of people to agree on anything in today’s partisan environment, that’s a strong signal.
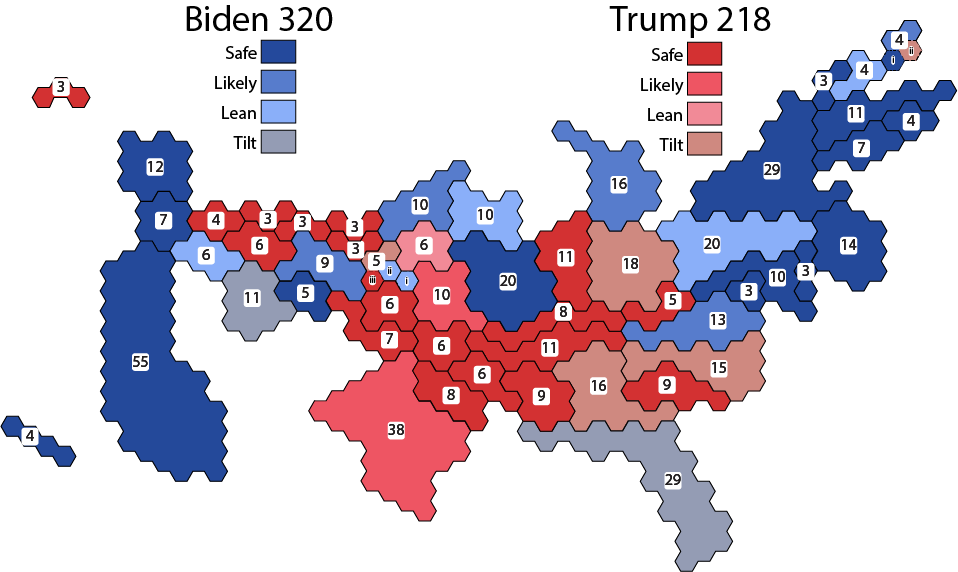
Similarly, polling data is starting to turn more strongly in favor of Biden, and that is reflected in the updated prediction map below. I realized that linking directly to the 270towin geographic map means that I can’t link to a larger version of the prediction map. So below is the prediction map, and if you’d like to try it for yourself, see the link below it.
As always, I try to report the data as clearly as I can. I care more about the truth than I care about what I think.
My predicted election results as of today, October 5, 2020
The final score prediction is the same: Biden 320, Trump 218. But some of the predicted confidence levels have changed:
Probably most importantly for determining the outcome: with Biden opening up a six-point aggregate polling lead there, I have switched Pennsylvania from “tilt Biden” to “lean Biden”
And similarly, I have changed both New Hampshire and Nebraska’s second congressional district to lean Biden
Don’t be surprised if some of these states tilt back toward Trump now that the President is out of the hospital. But still, time is running out for Trump’s re-election chances – many people have already voted.
Including me – I dropped my ballot in the city lockbox on Saturday afternoon, and I got confirmation today that it has been received and counted. My voice has counted, and I hope yours will too. Vote!
My Mac’s processor trying to keep up with the calculations required by my COVID-19 spreadsheet
Unfortunately, COVID-19 has affected so many people in so many places that my spreadsheet has gotten too big to work with. Going from the raw data provided by the Corona Data Scraper citizen science project to my graphs now literally takes about 4 hours of constant attention to Excel. I’ll have to rethink my approach.
Most likely I’ll do the preprocessing in Python, a simple but powerful programming language used by scientists all over the Universe. I’ll try to provide step-by-step instructions on how to how to run Python, and to document my programs extensively, so you can try them yourself. Even though Python can make graphs, I plan to continue making the graphs in Excel, because it’s a simple tool that so many of you already know how to use.
It might be a few days until my next COVID-19 update. In the meantime, I’ll keep posting other things on my usual Monday-Wednesday-Friday schedule, including something coming later today.