What the hell is this?
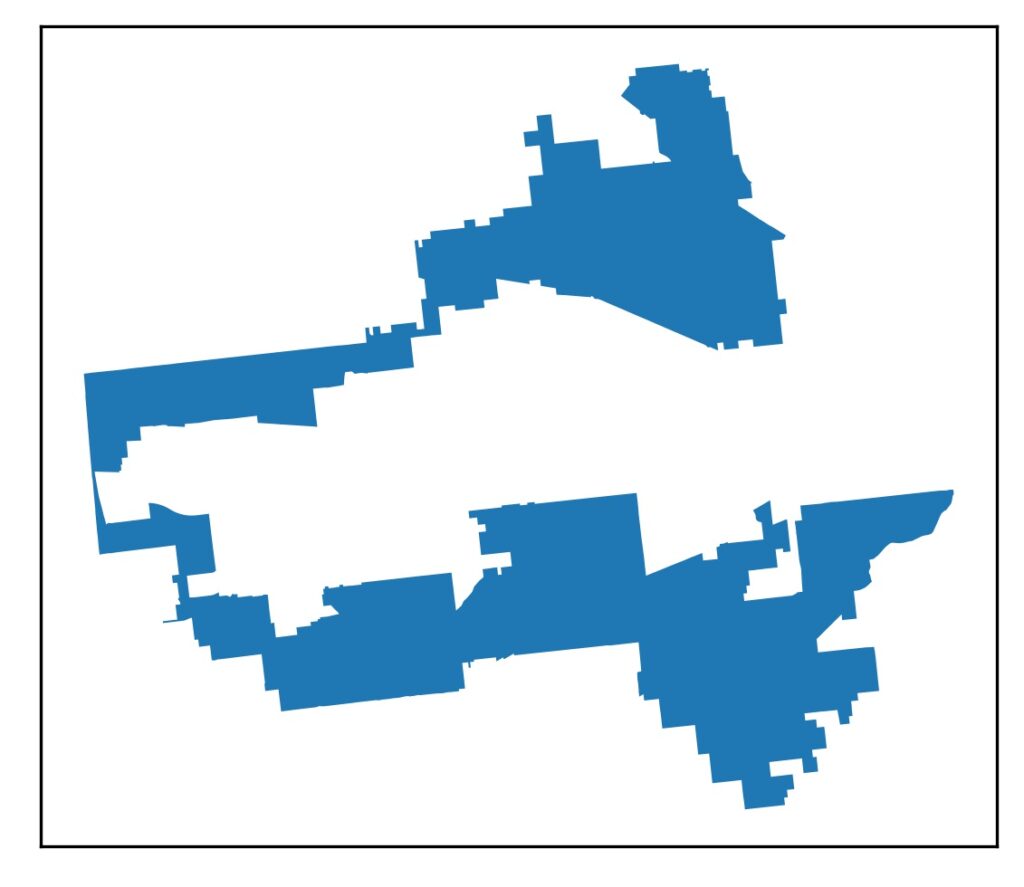
Impractical cardboard earmuffs? Rhode Island and Anti-Rhode Island about to disappear in a flash of cosmic rays?
…or how about this?
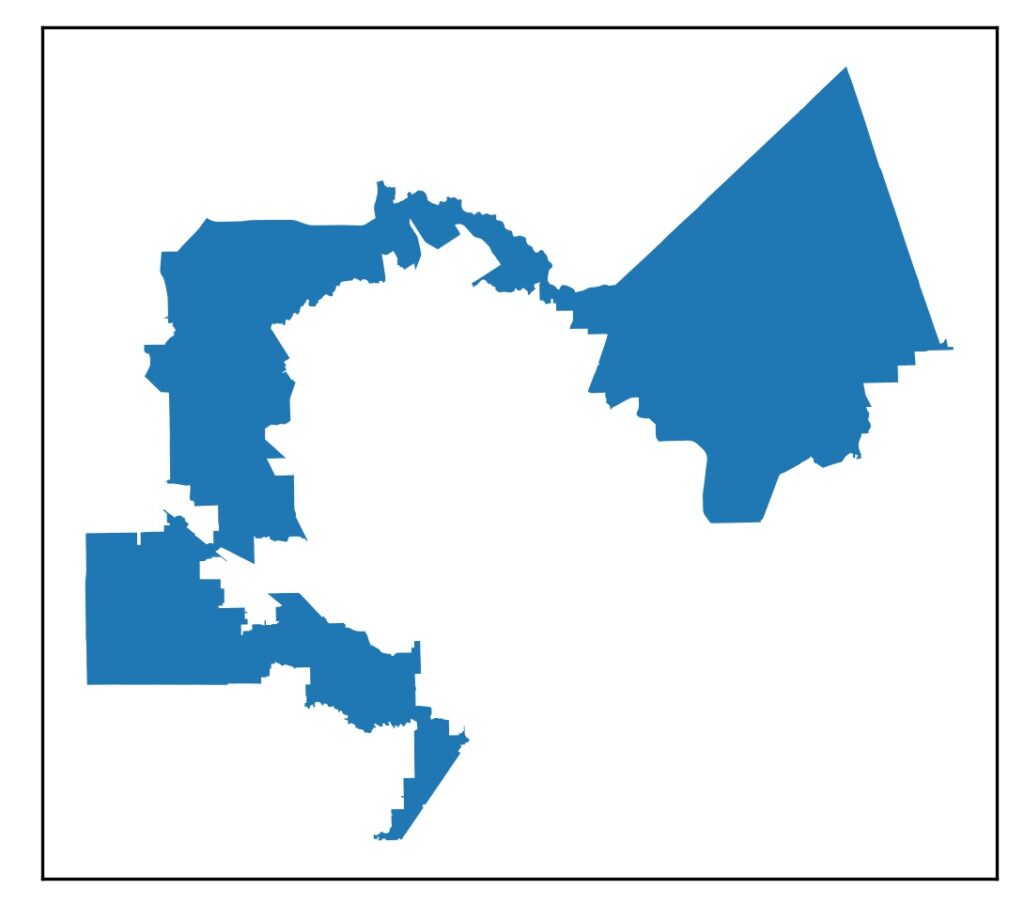
A top-heavy steam shovel falling off a cliff? The Big Dipper viewed from inside a black hole?
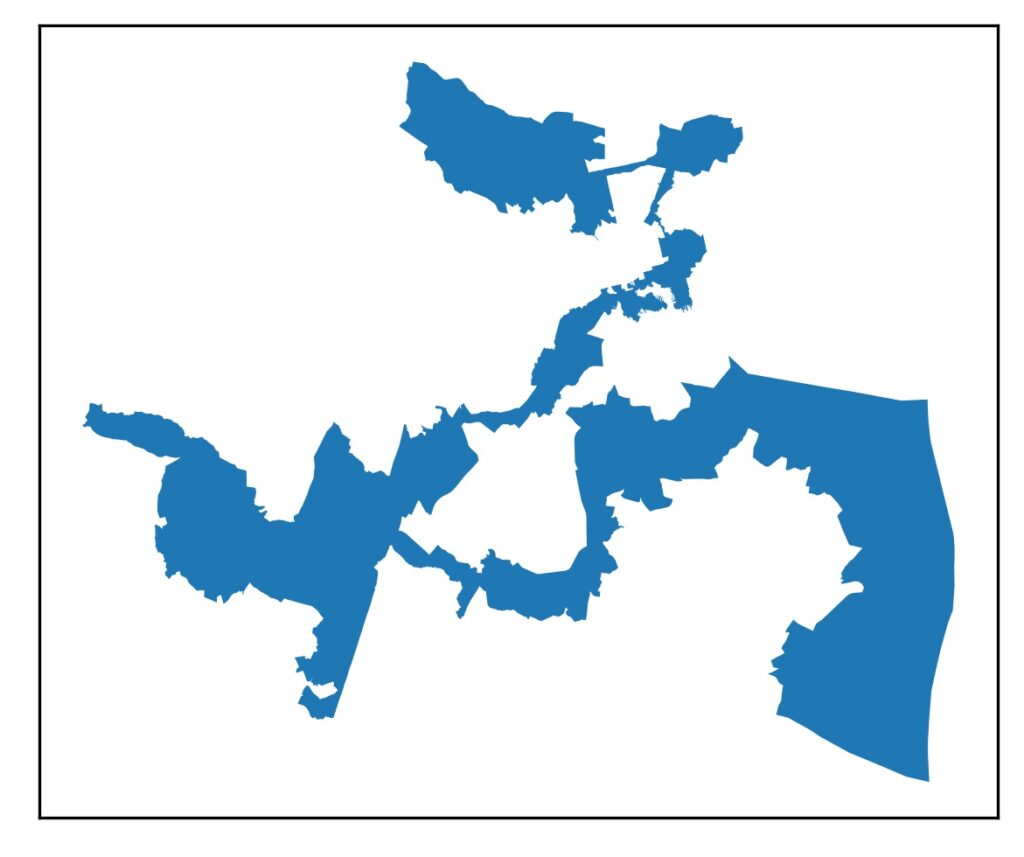
…or this?
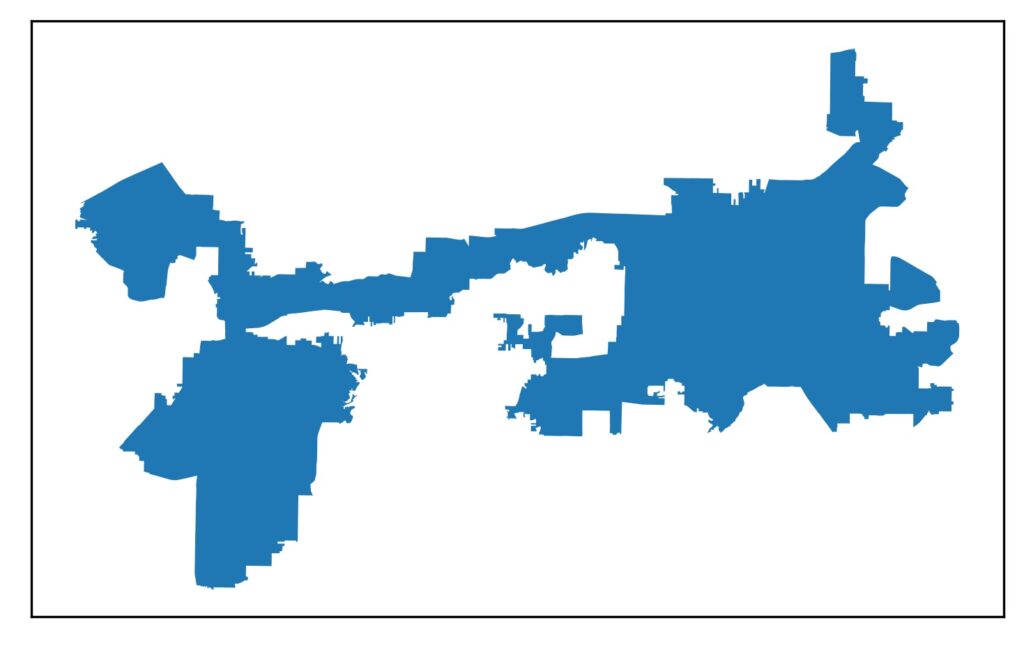
Did someone build a bridge to from Norway to Panama, and did Spain grow antlers?
No. These are United States Congressional districts under the influence of gerrymandering (from top to bottom, Illinois-4, Texas-2, and Texas-33).
What is gerrymandering, and how does it work?
Gerrymandering is the art and science of drawing the borders of Congressional districts to give an advantage to a political party or some other segment of the population.
Article 1 Section 2 of the U.S. Constitution says that the House of Representatives is elected by voters every two years. The number of representatives that each state gets is proportional to the population of the state, recalculated every ten years from the results of the decennial U.S. census. And that’s it.
The Constitution gives no details on how the representatives are distributed within the state, and different states had different practices. It took an act of Congress, the Apportionment Act of 1842, to standardize the process. Ever since, each state has been divided into districts, with one representative per district. This makes good sense – the citizens of Watertown, New York have very different needs from the citizens of Lower Manhattan, and they deserve to elect a representative who they believe will best meet their needs.
So how do you go from this general principle of local representatives to specific districts to be represented? In general, it’s up to each state legislature to divide the state into congressional districts. Districts must be contiguous (covering a single area, with no holes or outlying areas), and must have approximately equal populations. Other than that, and a few other legal requirements and guidelines we’ll look at later, it’s entirely up to the state legislature.
Leaving something so fundamental to the political process in the hands of a potentially partisan state legislature is a recipe for parties using the process to their advantage – and indeed, history has shown that creative assignment of congressional districts is one of democracy’s most effective cheat codes.
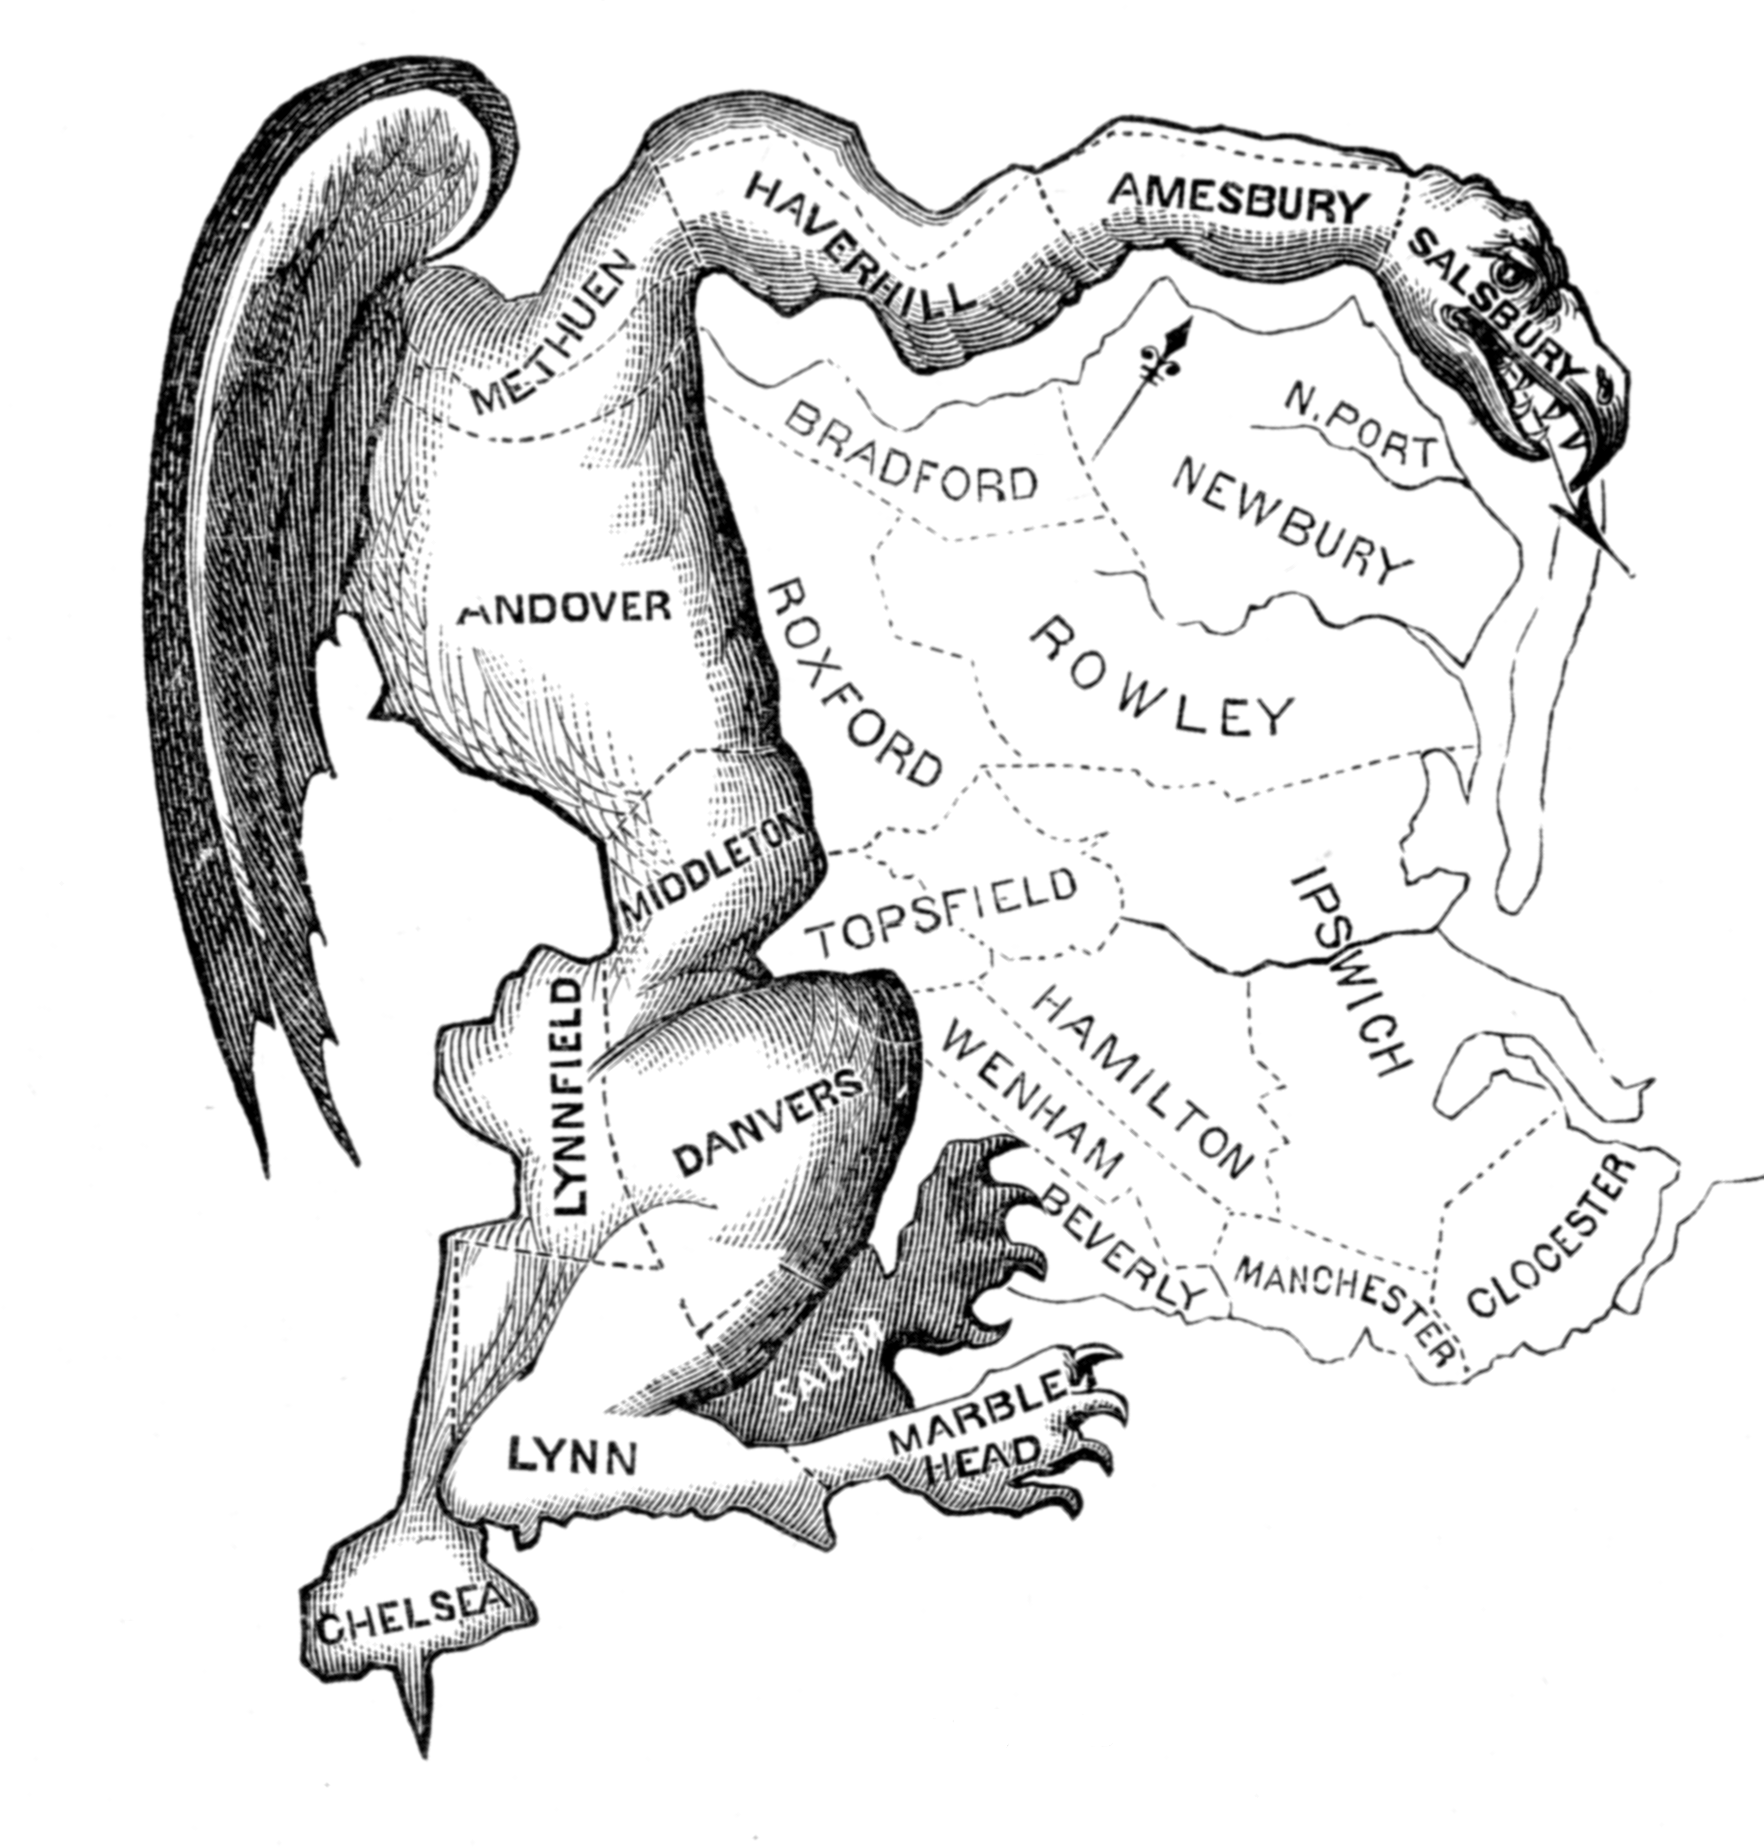
The name comes from the first famous proponent of the practice, former Massachusetts Governor Elbridge Gerry. In 1812, Gerry was in charge of designing Massachusetts’s 20 electoral districts (Massachusetts elected representatives by district even before the Apportionment Act of 1842 required it).
Gerry was a member of the Democratic-Republican Party in a state with a majority of voters from the opposing Federalist Party. He figured out the One Weird Trick to guarantee his party a House seat by connecting multiple Democratic-Republican strongholds west of Boston into a single long, narrow district. Federalists looked at a map of the district and noticed that it looked like a salamander, so they named it the “Gerrymander.” The carton shown here helped popularize the name, and solidified the opposition to Gerry’s proposal. The name stuck, and has been adopted worldwide – as a verb, adjective, and noun to describe the practice and its effects. (Interesting aside: Gerry’s name is pronounced with a hard G, as in gay, while the eponymous practice of gerrymandering is pronounced with a soft G, as in “Genesis Device.” I have no idea how that change happened).
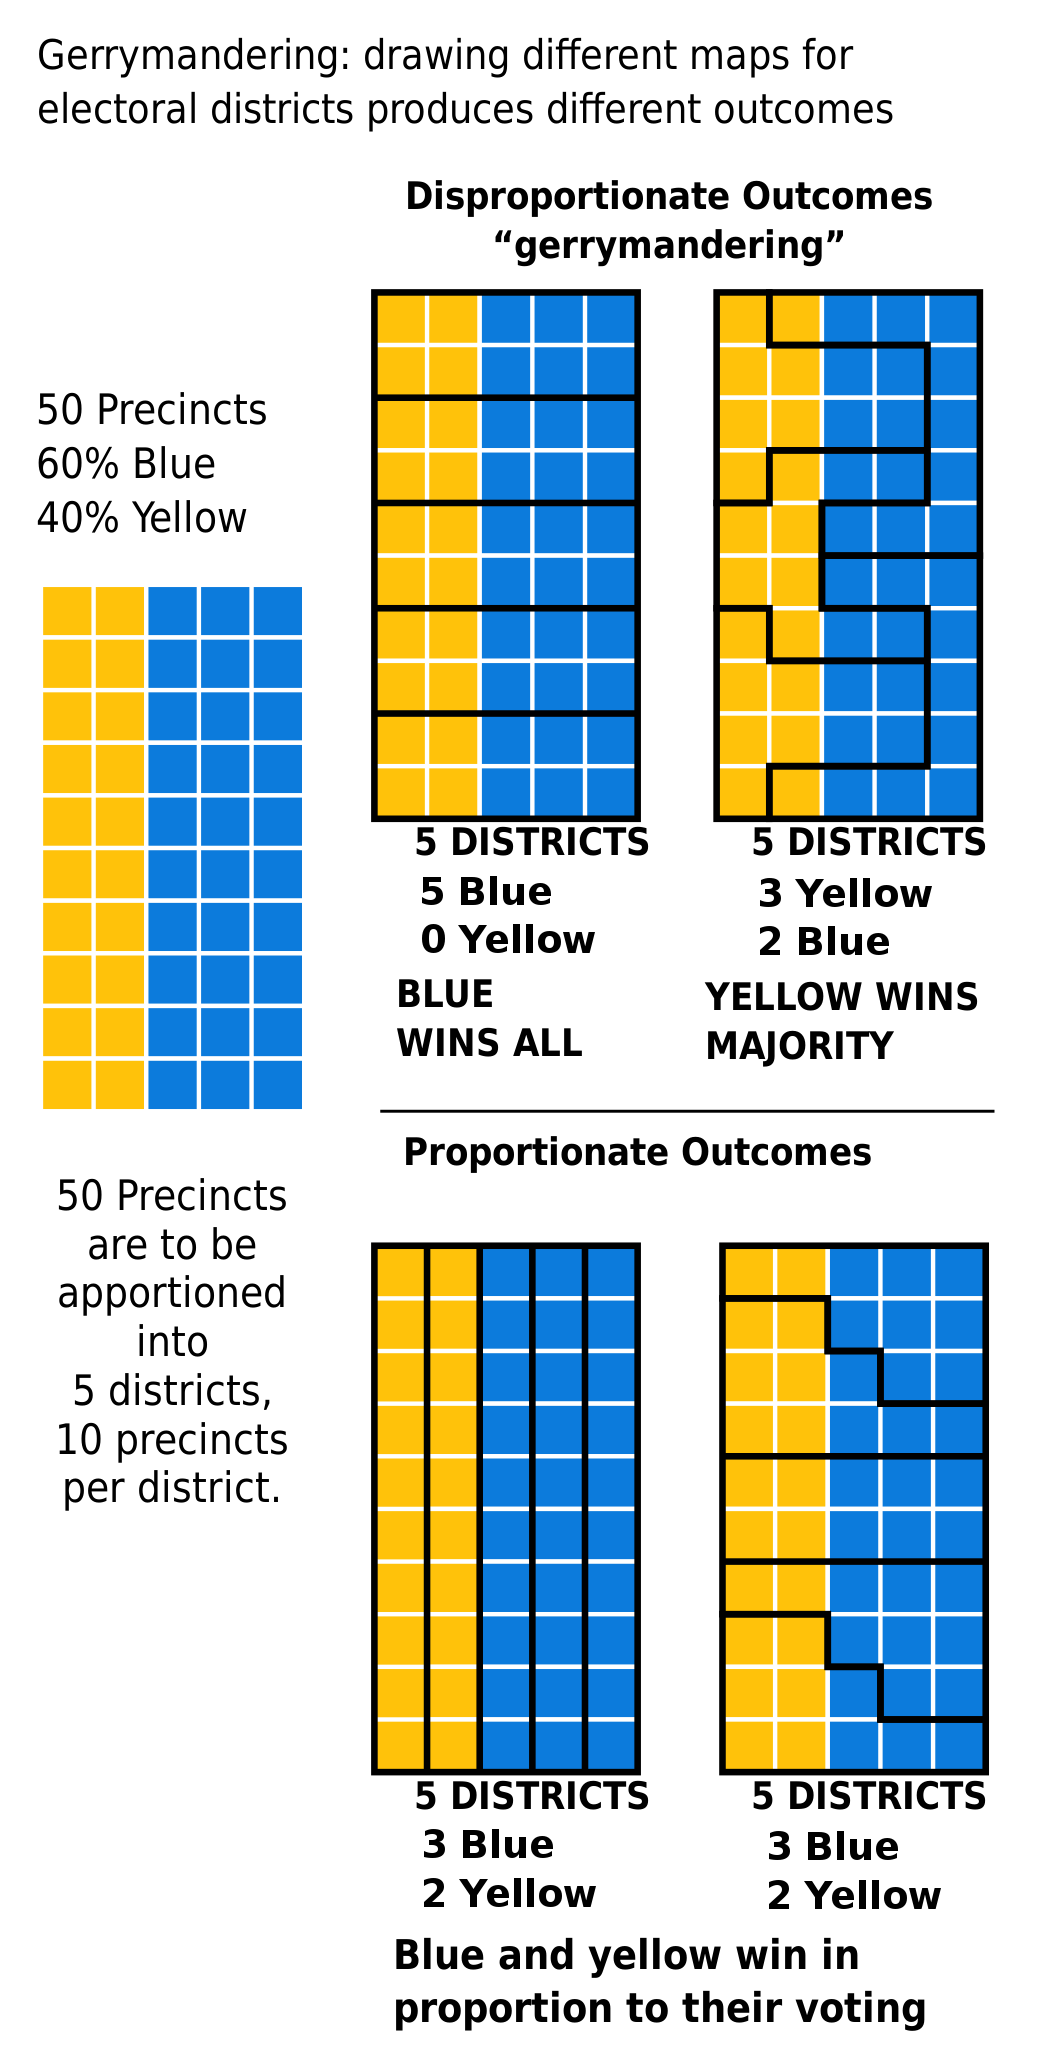
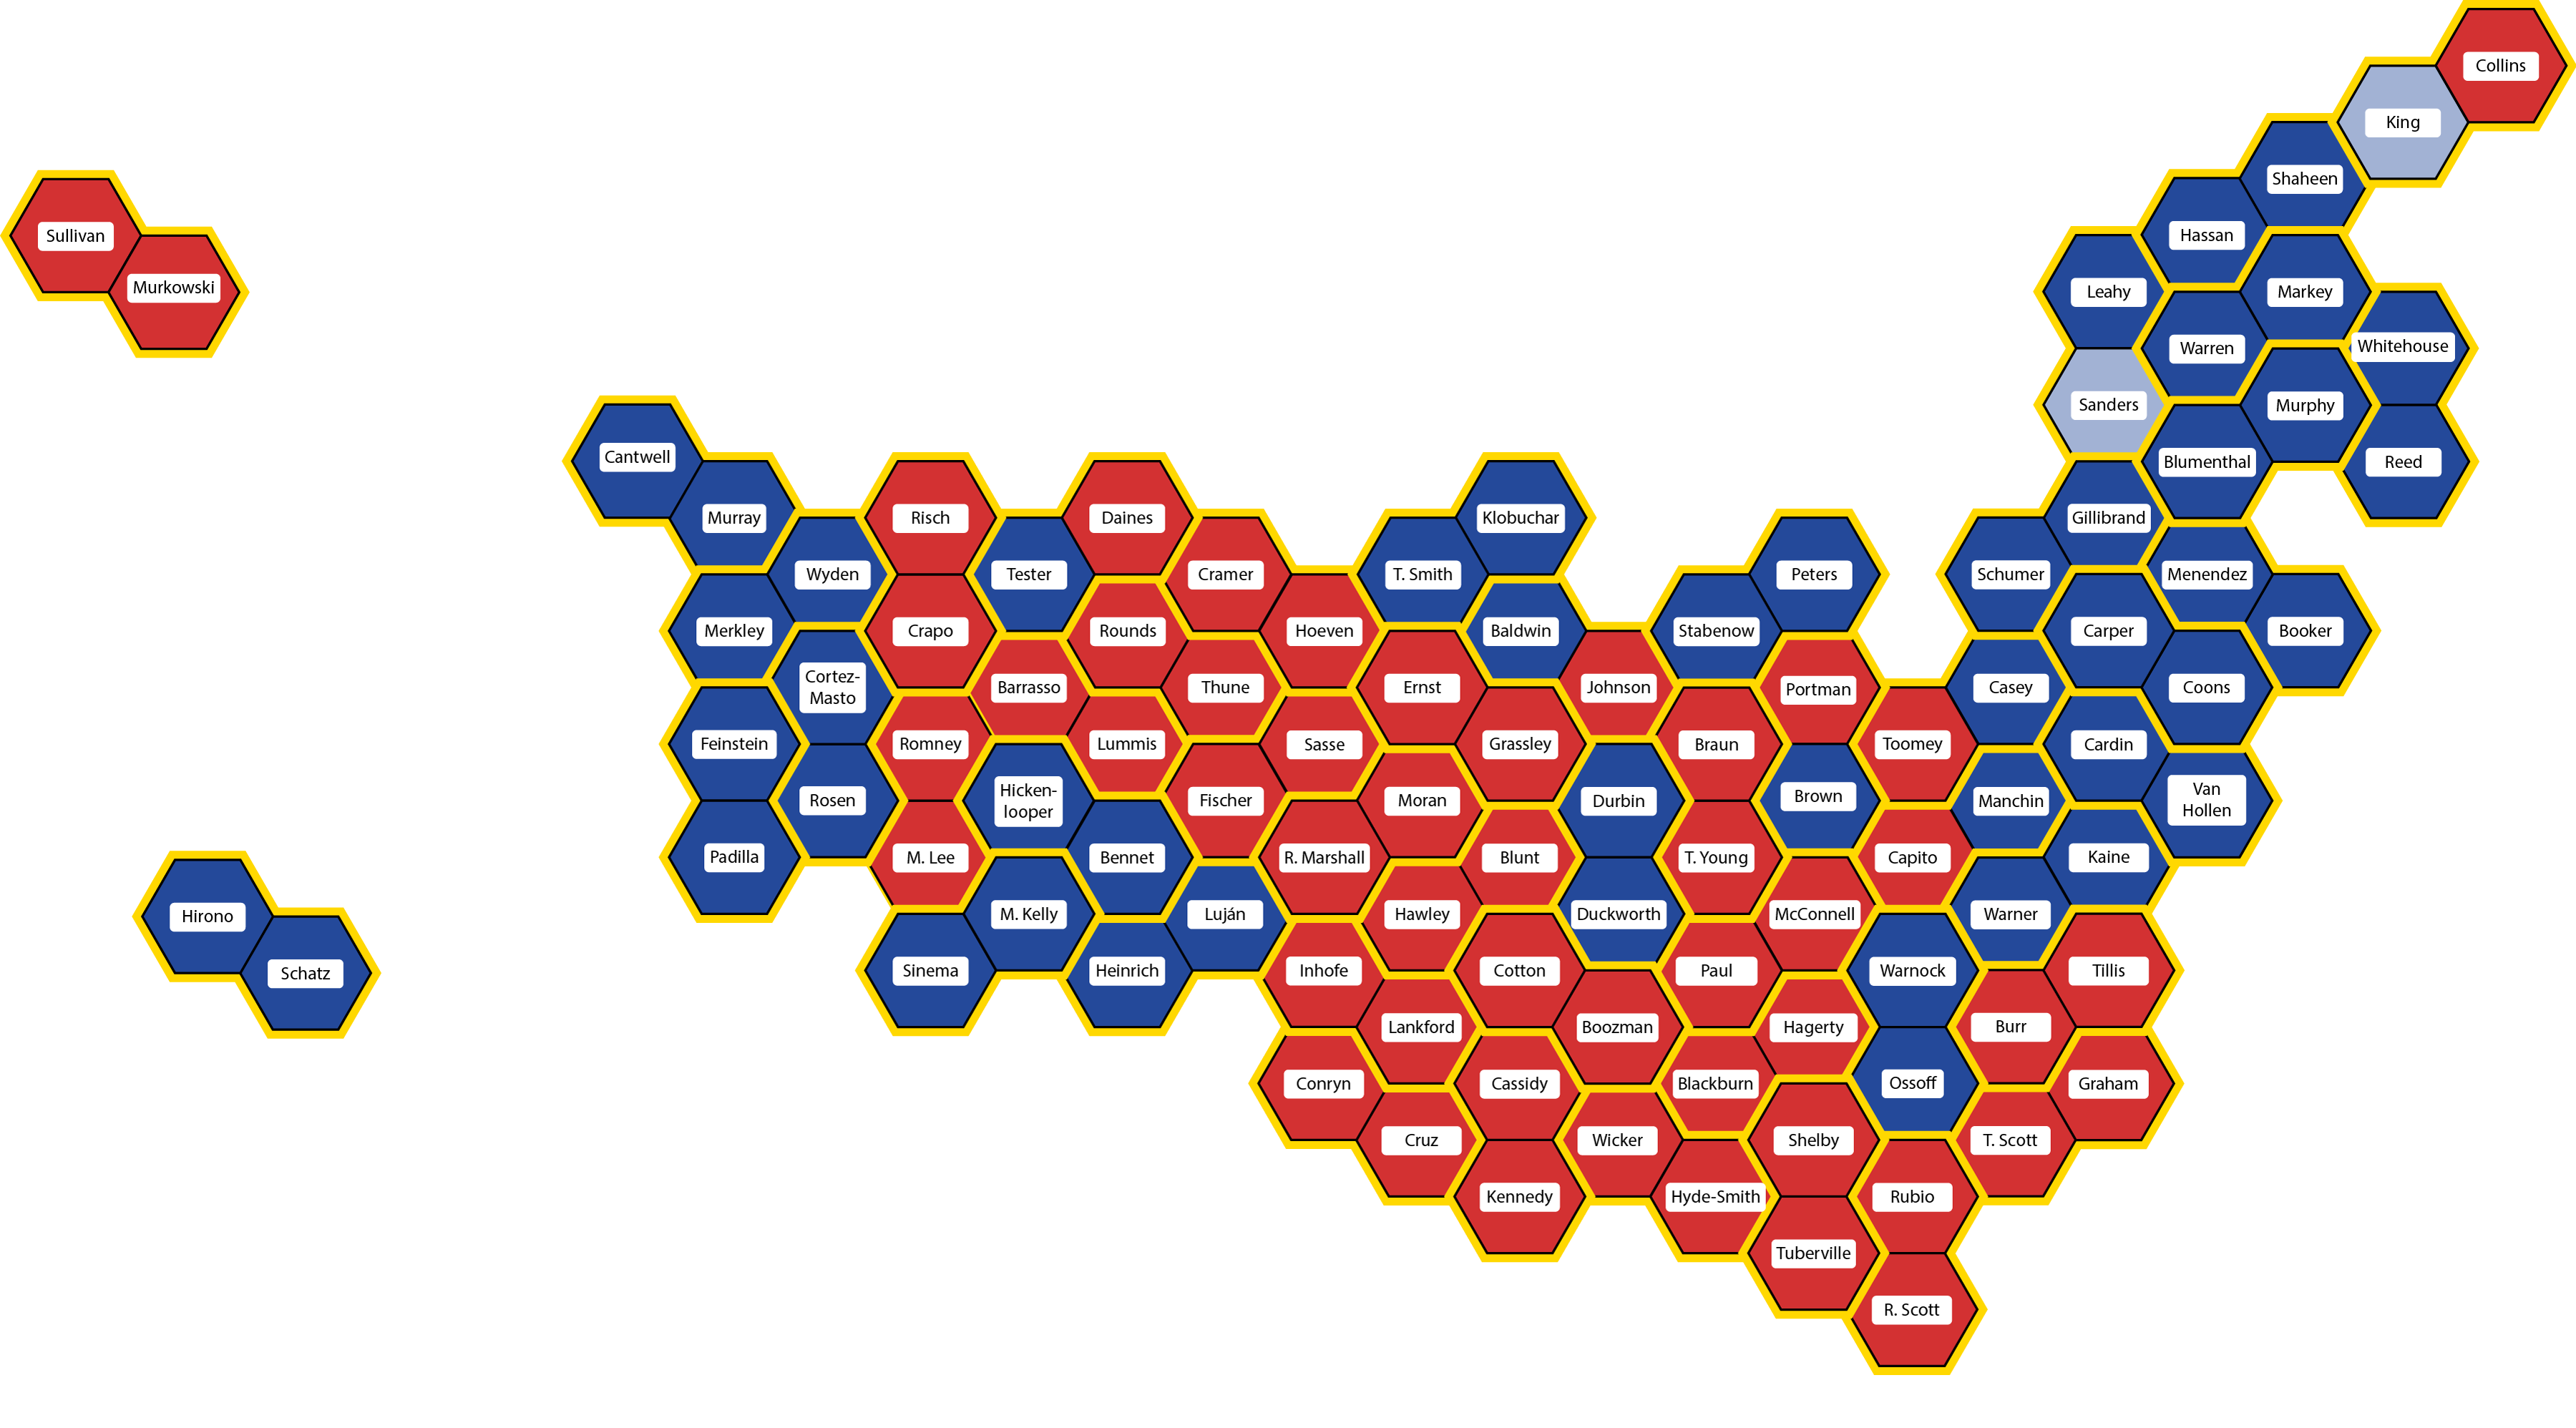
Image by Wikipedia user M.Boli
This diagram from Wikipedia is a great simple illustration of how gerrymandering works in practice. The rectangle shows an imaginary state where 60 percent of voters vote for the Blue Party and 40 percent for the Yellow Party. Where the state legislature draws the lines around districts will have a massive effect on how the state is represented.
It is easily possible to draw lines resulting in a majority of representatives for the Yellow Party, despite a clear voter preference for the Blue Party – or alternatively, to elect only Blue representatives, ignoring the opinions of 40 percent of voters. Or, hopefully, to design a legislature that really represents the will of the people.
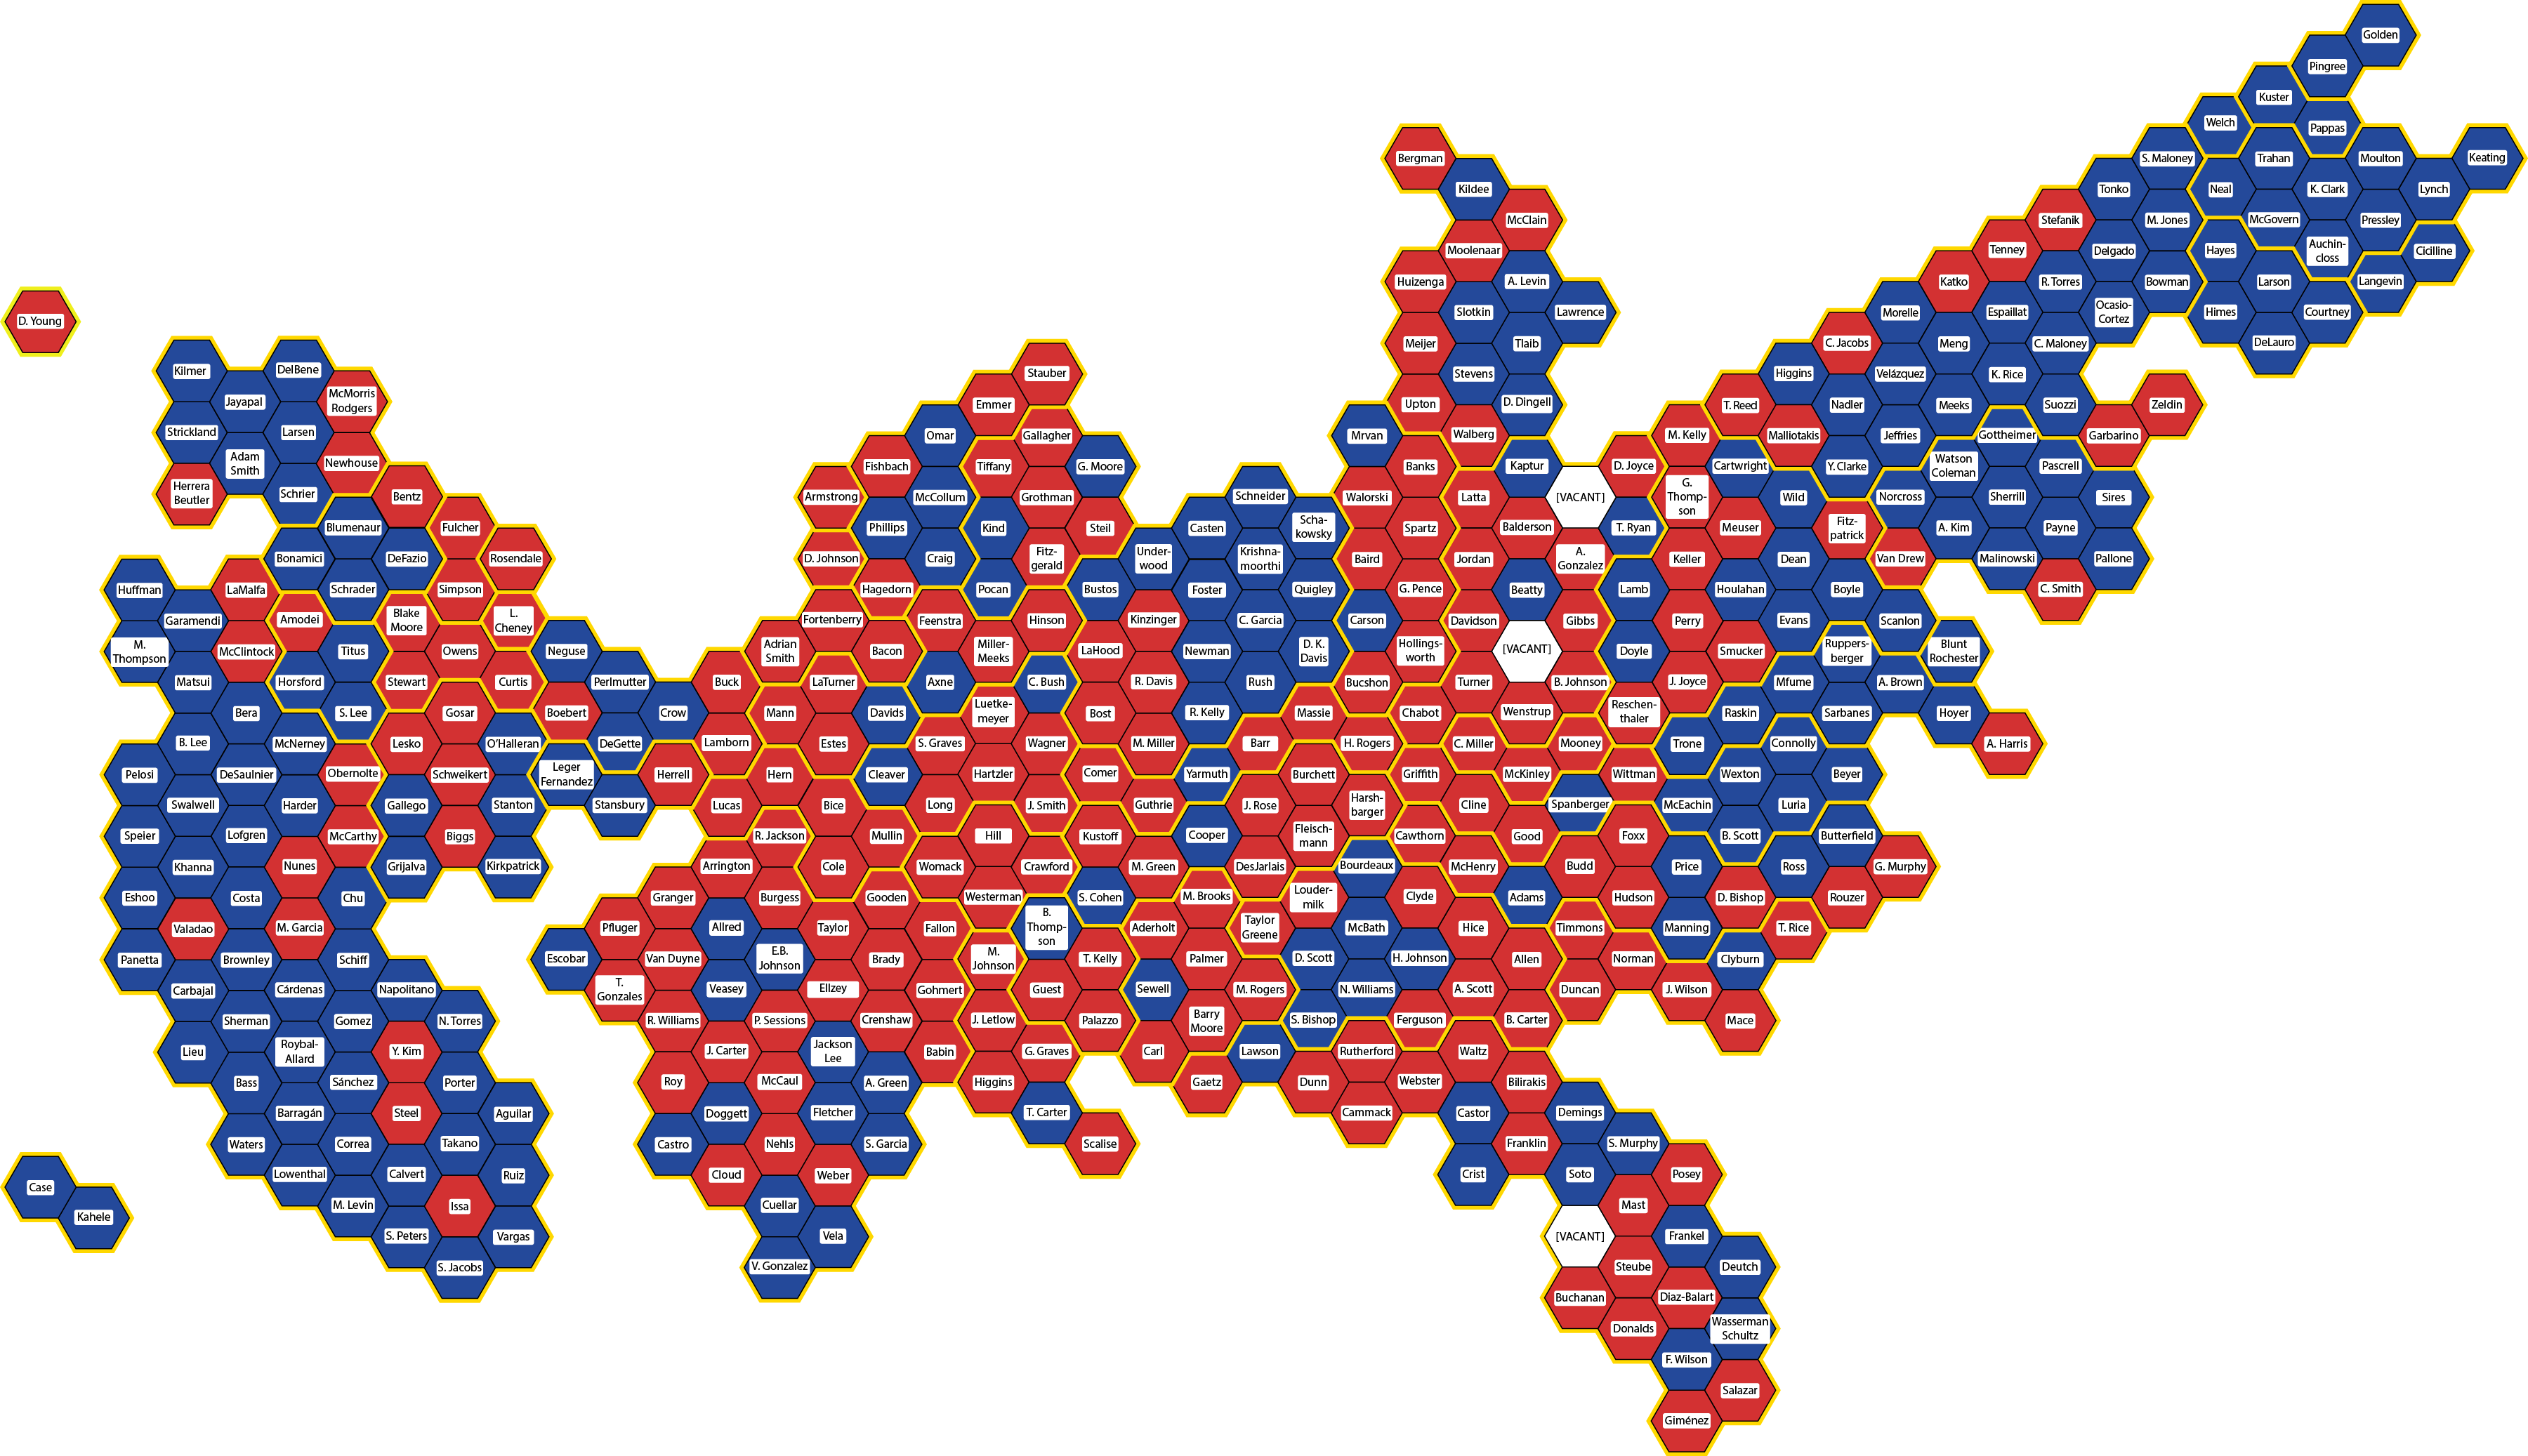
Stay tuned, because over the next several weeks (or months?), we’ll be taking a deep, deep dive into gerrymandering, with lots of maps and datasets to guide us. Along the way, we’ll explore the reasons for gerrymandering, the strategies used to enact it, and how it is employed (or not) in countries around the world. And, maybe most importantly, we’ll go state by state to look for ways to draw electoral district maps more fairly.
Coming up on Wednesday: a simple measure of how gerrymandered a state is, based solely on how weird the shape of the district is. This will make more sense once I tell you about the metric, but an obvious question is: what is the most weirdly-shaped district in the entire United States?
Right here. It’s the district I lived in from 2003 to 2021: Maryland’s 3rd district. Behold: